Assemblyman William Colton, Chair

Dear Reader:

I am pleased to present the 2001 edition of Where Will the Garbage Go?, the first one published under my chairmanship of the Solid Waste Commission. This year’s report possesses some key changes from previous years’ reports. While the primary goal of presenting comprehensive information on the management of municipal solid waste in New York State remains unaltered, this year’s report is in an abbreviated format. This was done in order to streamline the report without sacrificing the important information that it provides. I hope that you continue to find this report useful. Let me know your reaction.

As in 1999, overall municipal solid waste management activity in the year 2000 in New York State was strongly impacted by the continued phaseout of operations at New York City’s Fresh Kills landfill. With the final closure of Fresh Kills in March 2001, 2000 represented the last full year of operation. As in the previous three years, increased amounts of municipal solid waste were exported, recycling continued its upward trend, and landfilling in the state decreased, primarily the result of the phased closure of Fresh Kills. The continued trend in export clearly is prompting further actions by officials of waste-importing states who are pressing for the passage of federal legislation allowing states to restrict incoming waste.

Meanwhile, New York City is facing a fiscal crisis, particularly after the tragic events of September 11th, which may have consequences for its solid waste program. Furthermore, the City’s long-term plan is in disarray and export costs continue to rise. In response, the new Mayor recently announced his intent to suspend the recycling of some materials and to replace container deposits with a 5-cent user fee. Instead, however, the City’s task in the next few months should be to explore new ways of expanding its recycling program at the same time using it to create jobs and reduce energy usage and pollution.

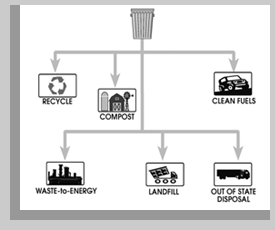
As a whole, New York State should continue to strive to manage waste in a more efficient and environmentally sound manner. While in-state disposal capacity can clearly provide some relief, we should retain our primary focus on the top of the solid waste hierarchy: reduction, reuse, and recycling. Many untapped or underutilized 3 R’s technologies show significant promise for managing greater portions of the waste stream. For example, although far from maximized, wastes such as electronics and organics are being increasingly reclaimed, reducing toxics, and saving disposal capacity and other resources. At the same time, fostering promising waste reduction and recycling technologies can also provide vibrant economic opportunities. Initiatives that produce such a combination of welcome results are ones that this state must pursue.

Signature     


Assemblyman William Colton, Chair
Legislative Commission on Solid Waste Management
April 2002


Table of Contents


MAJOR FINDINGS

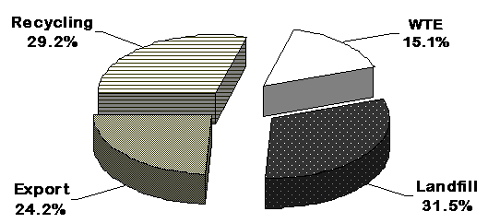
  • In 2000, 24 million tons of municipal solid waste (MSW) were managed in or exported from New York State, up 5.4% from the 1999 total.

  • The amount of the MSW identified as recycled in 2000 was 7 million tons, representing 29.2% of the total identified waste stream, and up 18.9% from 19991.

  • Waste disposed at the 28 operating MSW landfills in New York State during 2000 totaled 7.6 million tons, an 8.1% decrease from the previous year.2,3 Landfilled waste accounted for 31.5% of the total waste stream in 2000.2,3

  • Waste combusted at 10 waste-to-energy (WTE) plants, 3.6 million tons in 2000, decreased 40,000 tons (1.1%) from the 1999 level. This option accounted for 15.1% of the managed waste.

  • Waste exported from the State totaled 5.8 million tons, up over 700,000 tons, or 13.9%, from 1999.3 Export represented 24.2% of the waste stream.

  • In 2000 there were 28 operating MSW landfills, the same number that operated in 1999. There were no closings and no openings of landfills during 2000.

Municipal Solid Waste Management
2000


Graph
1Some of the increase in recycling can be attributed to the inclusion, for the first time in the Commission’s data compilation, of some of the commercial recycling in New York City (approximately 420,000 tons).
2This year’s report excludes waste that was disposed at five landfills since 1996, which was included in previous reports. These facilities used to be primarily MSW landfills but since 1995 disposed primarily non-MSW wastes including clean fill, construction & demolition debris, and MSW ash (raw MSW has been prohibited from landfill disposal on Long Island pursuant to the Long Island Landfill Law). The tonnages at these landfills totaled slightly under one million tons per year.
3Much of the landfill decrease and export increase in 2000 can be attributed to the inception during 1999 & 2000 of additional contracts by NYC for increased portions of the City’s Department of Sanitation-collected residential waste to be diverted from disposal at Fresh Kills landfill to facilities outside of the City. Waste disposed at Fresh Kills was 900,000 tons less in 2000 than in 1999.


Waste Management Summary
1990-2000

in thousands of tons
(percentage of year’s total waste in parentheses)

Option 1990 1991 1992 1993 1994 1995
Recycling 1,070 (5.6) 1,635 (8.2) 2,072 (10.3) 2,975 (14.8) 3,189 (15.8) 4,432 (21.2)
WTE 2,942 (15.5) 3,096 (15.6) 3,371 (16.7) 3,421 (17.0) 3,386 (16.8) 3,542 (16.9)
Incineration 891(4.7) 969 (4.9) 880 (4.4) 500 (2.5) 29 (0.1) 0
Landfill 10,951(57.5) 10,438 (52.4) 9,958 (49.4) 9,358 (46.4) 9,431 (46.8) 9,085 (43.5)
Export 3,181 (16.7) 3,774 (19.0) 3,874 (19.2) 3,907 (19.4) 4,119 (20.4) 3,849 (18.4)
Total 19,035 (100) 19,912 (100) 20,156 (100) 20,160 (100) 20,154 (100) 20,908 (100)
Option 1996 1997 1998 1999 2000 % change 1999-2000
Recycling 4,591 (22.5) 5,087 (25.1) 5,238 (24.7) 5,903 (25.9) 7,0171 (29.2) + 18.9
WTE 3,668 (18.0) 3,677 (18.1) 3,670 (17.3) 3,680 (16.1) 3,638 (15.1) - 1.1
Landfill 8,6222 (42.3) 7,7852 (38.4) 7,9622 (37.5) 8,1272 (35.6) 7,5722,3 (31.5) - 8.1
Export 3,505 (17.2) 3,717 (18.3) 4,346 (20.5) 5,095 (22.3) 5,8043 (24.2) +13.9
Total 20,386 (100) 20,266 (100) 21,218 (100) 22,805 (100) 24,031 (100) + 5.4
This table shows the yearly tons managed by various waste management alternatives and totals from 1990 through 2000. The last column shows percentage changes in those tonnages from 1999 to 2000. The total tons of waste identified have risen from 19 million in 1990 to 24 million in 2000 (28% increase).


Waste Management Comparison
1990-2000
Graph
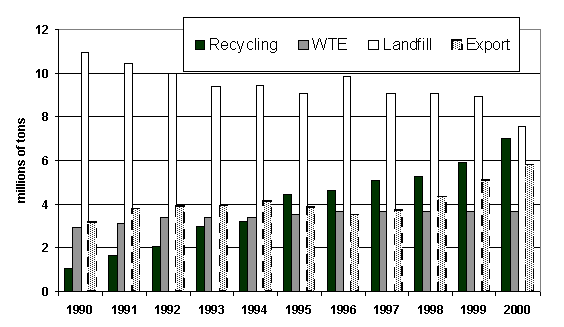
This graph illustrates the yearly tons of solid waste managed by various waste management methods. It shows the ten-year trends of the waste managed by the methods: growth in recycling; constancy in waste-to-energy; decline in landfilling; and growth in export.

Municipal Recycling
in New York State, 1990-2000
Graph
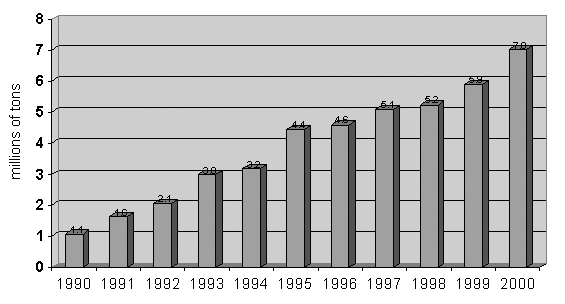
This graph shows the upward trend in recycling reported by municipalities or planning units from 1990 to 2000. Reported recycling rose from 1.1 million in 1990 to 7 million in 2000, an increase of 556% for the ten-year span. While some of the gain can be attributed to more recycling, a significant portion comes from greater identification of recycling activity (e.g. recycling that is done in the private sector).


Waste-to-Energy
in New York State, 1990-2000
Graph
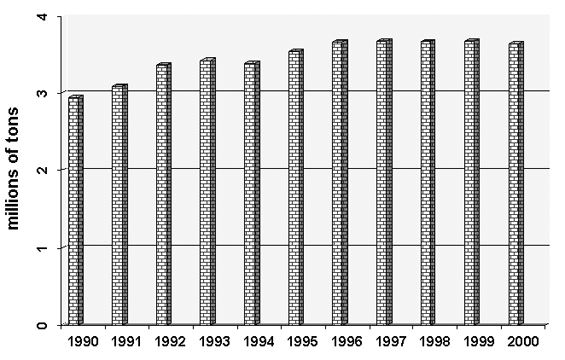
The Waste-to-Energy graph shows the tons of solid waste disposed in waste-to-energy facilities in New York State from 1990 to 2000. It indicates steady growth over the first half of the 1990s after which the yearly amounts changed little. Overall, the tonnage of waste disposed in waste-to-energy facilities has increased by 23.7% since 1990.

ACTIVE WASTE-TO-ENERGY FACILITIES
AS OF DECEMBER 31, 2000
Facility Name County Owner Type
Hempstead RRF
Islip RRF
Babylon RRF
Huntington RRF
Dutchess Co. RRA
Charles Point RRF
Adirondack RRF
Onondaga Co. RRA
Oswego Co.
American Ref-Fuel -Niagara Falls
Nassau
Suffolk
Suffolk
Suffolk
Dutchess
Westchester
Washington/Warren
Onondaga
Oswego
Niagara
Private
Municipal
Municipal
Municipal
County
County
County
County
County
Private


Disposal in Sanitary Landfills
in New York State, 1990-2000
Graph
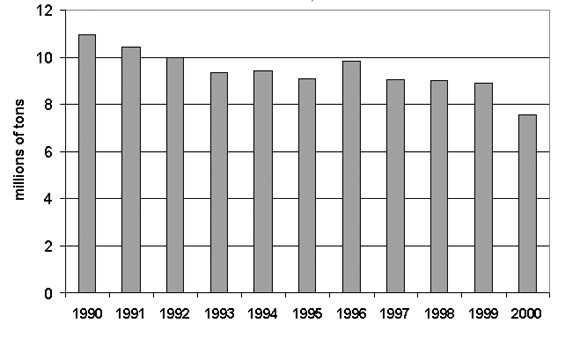
This graph shows the solid waste disposed at sanitary landfills in New York State from 1990 through 2000. Most of the 3.4 million ton (30.9%) decrease in the yearly amount of waste landfilled from 1990 to 2000 is attributable to the closure of Fresh Kills landfill in New York City, which dropped its disposed tons from 3.9 million in 1996 to 1.5 million in 2000.

Out-of-State Disposal
1990-2000
Graph
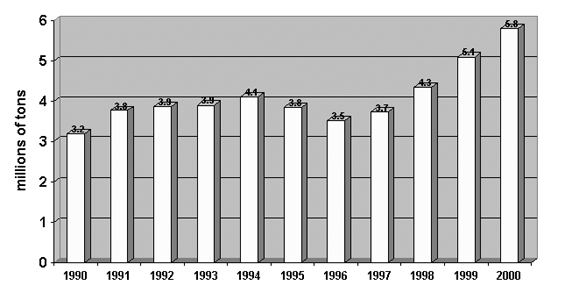
The Out-of-State Disposal graph illustrates the annual tons of MSW exported out of New York State for disposal. The 81.3% increase in annual exports from 1990 to 2000 is primarily attributable to increased diversion of waste from disposal at Fresh Kills landfill, as it has been phasing out of operation since 1997.


Number of Sanitary Landfills by Yearly Tonnages
1988 & 2000
Thousands of tons/year 1988 2000
Publicly-Owned Privately-Owned Total Publicly-Owned Privately-Owned Total
< 100 167 11 178 11 1 12
100 to 500 17 8 25 9 2 11
> 500 1 2 3 1 4 5
Total 185 21 206 21 7 28*
* The 28 landfills operating at the end of 2000 are listed in the box below.

Shown in this table is the number of active landfills in New York State in 1988 and 2000 by annual intake with a breakdown between public and private ownership of the facilities. The number of operating sanitary landfills was 86.4% lower in 2000 than it was in 1988, but nearly the entire decline from 206 to the current 28 occurred by 1997, when the number had fallen to 30 (not shown here). Nearly all of the landfills closed since 1988 (as well as prior to that) were small municipal landfills, primarily town dumps.

ACTIVE SANITARY LANDFILLS*
AS OF DECEMBER 31, 2000
Facility Name County Owner Type
   Fresh Kills
   Al Turi
   Sullivan County
   Greater Albany
   Colonie Town
   Delaware County
   Schuyler Falls
   Franklin County
   Fulton County
   Development Authority of the
      North Country
   Broome County
   Auburn City
   Chenango County
   Cortland County
   Madison County
   Bristol Hill
   Chemung County
   Mill Seat
   High Acres Western Expansion
   Ontario County
   Seneca Meadows
   Steuben County
   Allegany County
   Hyland
   Ellery
   CID
   Modern
   Niagara Recycling
Richmond
Orange
Sullivan
Albany
Albany
Delaware
Clinton
Franklin
Fulton

Jefferson
Broome
Cayuga
Chenango
Cortland
Madison
Oswego
Chemung
Monroe
Monroe
Ontario
Seneca
Steuben
Allegany
Allegany
Chautauqua
Erie
Niagara
Niagara
Municipal
Private
County
Municipal
Municipal
County
County
County
County

County
County
Municipal
County
County
County
County
County
County
Private
County
Private
County
County
Private
County
Private
Private
Private


Solid Waste Management in New York State by DEC Region in 2000
(in thousands of tons)

DEC Region Recycling WTE Landfill Export TOTAL
1 723 1579 0 384 2686
2 2343 0 1487 4770 8660
3 1228 797 195 620 2840
4 139 0 471 0 610
5 50 157 307 0 514
6 263 0 245 0 508
7 1021 396 268 0 1685
8 851 0 2524 0 3375
9 398 710 2075 30 3213
TOTAL 7017 3638 7572 5804 24031

The above table summarizes how waste was managed in each DEC region during 2000. Recycling tons are as reported by the counties (or planning units) of the region. Waste shown as landfilled or burned represents all that was disposed at facilities in a region. The waste export category refers to waste generated in the region which was sent out-of-state.

SOLID WASTE MANAGEMENT PLANNING UNITS
by DEC Region
Region 1
Town of Babylon
Town of Brookhaven
Town of East Hampton
City of Glen Cove
Town of Hempstead
Town of Huntington
Town of Islip
City of Long Beach
Town of North Hempstead
Town of Oyster Bay
Town of Riverhead
Town of Shelter Island
Town of Smithtown
Town of Sounthampton
Town of Southold
Fishers’ Island

Region 2
New York City

Region 3
Dutchess County RRA
Orange County
Putnam County
Rockland County SWMA
Sullivan County
Ulster County RRA
Westchester County
Region 4
ANSWERS
Town of Colonie
Columbia County
Delaware County
Greene County
Montgomery, Otsego, Schoharie SWMA
Eastern Rensselaer County SWMA
Greater Troy SWMA
Schenectady County

Region 5
Clinton County
Essex County
Franklin County
Fulton County
Hamilton County
Saratoga County
Washington/Warren Counties

Region 6
Jefferson County
Lewis County
Oneida-Herkimer SWMA
St. Lawrence County
Region 7
Broome County
Cayuga County
Chenango County
Cortland County
Madison County
Onondaga County
Oswego County
Tioga County
Tompkins County

Region 8
Chemung County
Genesee, Livingston, Orleans, Wyoming Counties (GLOW)
Monroe County
Schuyler County
Steuben County
Western Finger Lakes SWMA

Region 9
Alllegany County
Cattaraugus County
Chautauqua County
Erie County
Northwest Communities of Erie County
Niagara County


Photo MUNICIPAL SOLID WASTE MANAGEMENT FINANCIAL ASSISTANCE

New York State has a long history of funding municipal solid waste management programs. The following section provides descriptions of programs developed over the years to support municipal waste reduction and recycling, resource recovery project development, solid waste management planning, and landfill closure.

  • 1996 Clean Water/Clean Air Bond Act

    The Bond Act was approved by the voters in November 1996, and provides $1.75 billion for a wide range of environmental projects. The Act provides $175 million for solid waste projects which includes: 1) $50 million for municipal recycling projects; 2) $50 million for closing, capping, and other costs, including gas recovery projects, associated with solid waste disposal at municipal landfills (90% grants for communities with less than 3,500 population; 50% or a $2 million cap on grants for the remainder); and 3) $75 million toward the cost of closing and capping New York City’s Fresh Kills landfill.

    The State’s FY 2001-2002 budget included the following Bond Act appropriations: $13 million for municipal recycling grants, $2 million for municipal landfill closure, and $30 million for Fresh Kills’ closure. In FY 2000-2001, appropriations were $5 million for municipal recycling grants, $1.5 million for municipal landfill closure, and $10 million for Fresh Kills’ closure. To date, $160.5 million of Bond Act funds have been appropriated for solid waste projects.

  • Environmental Protection Fund (EPF)

    The 1993 Environmental Protection Act (Chapters 610 and 611) established the Environmental Protection Fund (EPF). The EPF was designed to provide financial assistance for environmental purposes, including local solid waste management projects. Dedicated funds of the EPF are appropriated annually to the various programs by the Governor and the Legislature.

    In FY 2000-2001, a total of $18.2 million was appropriated for solid waste management programs. The municipal recycling program, administered through DEC, received $6.2 million and the secondary materials program, administered through the Department of Economic Development (DED), received $5 million. The landfill closure program, administered through DEC, received $7 million. To date, $153.8 million of EPF funds have been appropriated for solid waste projects. However, no EPF funds were appropriated for FY 2001-2002.

    Municipal Landfill Closure Funds

    Landfill closure grants are available for 50% of the project cost, up to a maximum of $2 million, except for municipalities with populations under 3,500. These smaller localities can receive a 90% grant, plus no-interest loans for the remaining 10%. Low-interest loans are also available for the municipal share of funding through the Environmental Facilities Corporation (see SRF description below).1

    EPF Waste Reduction and Recycling Projects Funding

    The EPF provides funds for two recycling programs, the waste reduction and recycling program and the secondary materials marketing program, administered by DEC and DED respectively. DEC’s municipal waste reduction and recycling program provides 50% matching grants to municipalities for costs incurred in waste reduction or recycling projects. The cost of recycling education projects, including municipal recycling coordinators, also became eligible for these grants through the passage of legislation in 2000. Additionally, DED’s secondary materials marketing program provides 50% matching grants to municipalities, non-profits, and small to medium size businesses for development of recycling markets. This program was expanded in 1998 to include grants for waste prevention projects.

  • State Revolving Loan Fund (SRF)

    Pursuant to the Federal Water Quality Act of 1987, New York State provides low-interest loans to municipalities for clean water projects including sewage treatment plant construction and expansion through the SRF. The Environmental Facilities Corporation, which administers the SRF, also provides low-interest loans for municipal landfill closure under this program.

  • 1Landfill closure funding is also provided under the State Superfund Program (Title 3) for municipally-owned landfills which have received hazardous waste.


    FLOW OF MUNICIPAL SOLID WASTE
    Flowchart

    The 1994 U.S. Supreme Court decision in the Carbone case overturned flow control laws that directed MSW to designated facilities. That decision led an increased number of haulers to shop around for the best disposal arrangement. This often impaired municipalities and solid waste authorities that relied on the guaranteed tonnage provided by flow control to finance new disposal and recycling facilities in the 1980’s and early 1990’s. Efforts to blunt the impact of the Court’s decision were successful in a few areas, most notably Smithtown and Babylon on Long Island where waste collection districts were instituted creating "contractual" or "economic" flow control arrangements. These systems, however, have not proven workable for many municipalities and solid waste authorities that formerly relied on flow control. Many have since had to subsidize their operations so that lowered tip fees would attract haulers.

    A recent U.S. Second Circuit Court of Appeals decision, however, validated the means by which many municipalities initially instituted flow control. In July 2001, the case was decided in favor of Oneida-Herkimer Solid Waste Management Authority stating that flow control ordinances like Oneida-Herkimer’s are allowable because they direct waste to publicly-owned facilities. Since then, the U.S. Supreme Court denied the petition to appeal, meaning that the Second Circuit Court’s decision stands.

    Conclusion

    This year’s report highlights the continuing waste management trends of increased waste export, decreased in-State disposal (specifically landfilling), and increased recycling. These trends impact the way in which New York State addresses policies for the management of waste in the future.

    Increased waste export and decreased disposal capacity, in particular, have brought focus once again on possible interstate restrictions and, therefore, increased pressure on New York to take greater responsibility for managing the waste generated within the State. This means that New York State, in accordance with its solid waste management hierarchy, must maximize its efforts at waste reduction while at the same time promote greater opportunities for recycling and reuse technologies. Developing these opportunities would provide for both enhanced environmental protection and the growth of green industries.


    Where will the garbage go? 2001
    Legislative Commission on Solid Waste Management
    4 Empire State Plaza, 5th Floor, Albany, NY 12248

    Patrick Golden, Principal Author
    Marilyn M. DuBois, Editor
    Richard D. Morse, Executive Director


    In order to reduce waste, if you have a change in address, please inform the commission by mail, phone, or fax:
    Photo Assemblyman William Colton, Chair
    LCSWM
    4 Empire State Plaza, 5th Floor
    Albany, NY 12248
    (518) 455-3711
    (518) 455-3837 (fax)


    Photo


    New York State Assembly
    [ Home Page ]      [ Committees ]