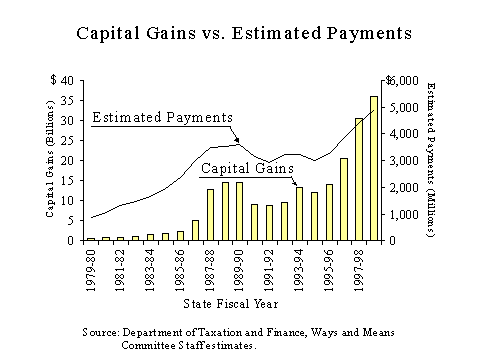
Figure 7
The troubled Asian economies, coupled with the devaluation of a number of their currencies, may affect many aspects of the national economy. The crisis, for example, may reduce the demand for U.S. exports, therefore, affect the level of corporate profits. However, it is unclear how much the Asian financial situation will affect New York State. Unlike California and other western states, New York is not as dependent on exports to Asia. In addition, manufacturing, for some time, has been a declining portion of our economic base.

Figure 7
However, there are a number of positive factors that will provide continued revenue growth in the State. One factor leading to a surge in receipts is capital gains. Once again, the Committee Staff estimates substantial growth in capital gains in the current fiscal year. Increased capital gains realizations were triggered by the reduction in Federal Capital Gains Tax rates that went into effect as of May 7, 1997, and of the success of the stock market in general. Basically, the long-term top rate on capital gains for individuals was reduced from 28 percent to 20 percent. After 2001, the gain from the sale of assets held for more than five years will be taxed at 18 percent. Taxes paid on income from capital gains find their way into New York State’s revenue stream through the Personal Income Tax, primarily in the form of estimated payments. As Figure 7 indicates, there is a strong correlation between the growth in capital gains and the level of estimated payments.
Another important factor affecting revenues is the payment of bonuses stemming from Wall Street. Strong growth in withholding, usually in the third and fourth quarters of the fiscal year, is the result of expected growth in bonuses. As the economy continues to grow, employees often receive extraordinary bonus incentives. As a result, seasonal spikes in withholding receipts arise during these months. Figure 8 denotes the Committee Staff estimate for quarterly bonus payments and their corresponding relationship to withholding collections. Since 1990, underlying growth in withholding has grown significantly as a result of increasing bonuses stemming from the strength of Wall Street.
Figure 8
Table 6 provides the Committee staff estimate for bonus payments and
capital gains.1 Bonus payments are expected to grow
by 30 percent in State Fiscal Year 1997-98. This growth contributed to
the Committee Staff estimate that withholding receipts will growth by 2.2
percent, despite the final phase of the Personal Income Tax reduction plan
becoming effective in 1997. Bonus payments are forecast to increase by
10.2 percent in State Fiscal Year 1998-99. The growth in bonus income is
expected to continue, but to be somewhat tempered in 1998, nonetheless,
withholding growth will respond favorably and is forecast to reach 8.3
percent.
1. Bonus payments listed by State Fiscal Year; capital
gains by Calendar Year 1997 and 1998.
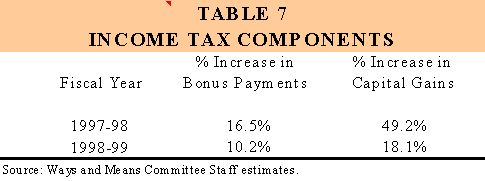
The Committee Staff estimates capital gains growth of 49.2 percent growth in 1997. This strong growth will have the effect of boosting Personal Income Tax liability in 1997. This is already evident and can be seen in the strong growth in estimated payments in State Fiscal Year 1997-98. The Committee Staff estimates growth of 14.7 percent in estimated payments, as taxpayers are reacting to large realizations in 1997. The Committee Staff forecast of 18.1 percent growth in capital gains in 1998 will translate into growth of 11.1 percent in estimated payments in State Fiscal Year 1998-99.
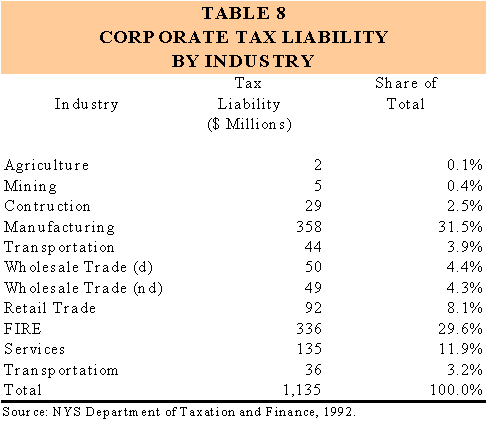
Just as the Personal Income Tax has benefited from increased bonus income and strong capital gains realizations, New York’s corporate taxes also benefit. As Table 7 shows, the Finance, Insurance and Real Estate sector (FIRE) contributes heavily to Corporate Franchise Tax liability.
Three consecutive years of spectacular stock market growth have helped create a very profitable environment for Wall Street firms. Individuals continue to invest money in mutual funds and other financial instruments. Substantial mergers and acquisitions have also increased significantly in 1997, and are expected to continue for 1998. Profits in the securities industry appear to have topped $12 billion in 1997. In addition, corporate profits grew by 8.1 percent in 1997, and the Committee Staff estimates that the growth in 1998 will total 5.7 percent.
Since the FIRE sector comprises almost 30 percent of the C-Corporation
liability under the Corporate Franchise Tax, strong corporate profits directly
result in higher tax liability under New York’s tax structure.
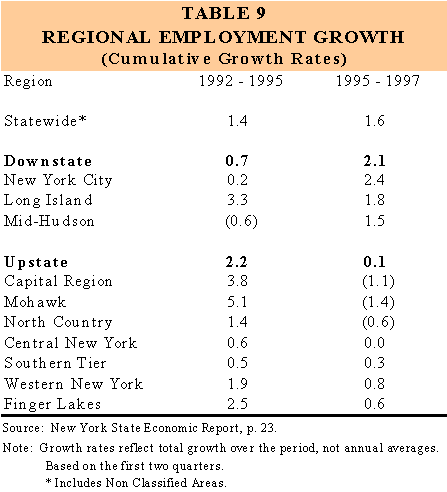
Many portions of the State are not experiencing the same benefits of
the current economic expansion as Wall Street. These areas of the State
have been affected by long-term declines in the manufacturing sector and
have been unable to overcome those losses. According to the latest data,
upstate employment growth increased by only 0.5 percent in 1997, compared
to 1.6 percent in Manhattan — where the bulk of Wall Street activity is
derived from. Further, no upstate region experienced job growth above 0.9
percent. For example, the Southern Tier region experienced a 0.9 percent
increase, but the Capital and Western regions only experienced a 0.7 percent
increase. The Finger Lakes and North Country regions saw virtually no growth
in employment, while the Mohawk and Central New York regions measured job
growth of 0.4 percent and 0.6 percent, respectively.2
2. ES-202. Based upon latest available data (first half
of 1997)
Since the rest of the State has been affected by long term declines in the manufacturing sector, this lack of growth in the upstate region has regional impacts on both the Personal Income Tax and the Sales Tax. A regional comparison highlights the importance of Wall Street’s contribution.
Personal Income Tax revenues are highly influenced by New York City
and the surrounding counties. The metropolitan area contributes to a significant
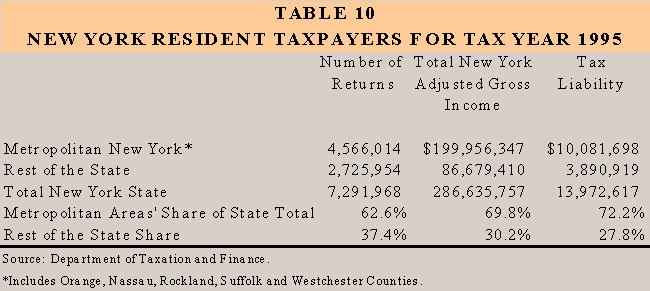
portion of Personal Income Tax liability. As Table 10 indicates, this region
constitutes approximately 63.0 percent of all returns, resulting in over
70.0 percent of all Personal Income Tax liability. New York City, by itself,
accounts for approximately 37.0 percent of all Personal Income Tax liability.
As a result, when New York City, including Wall Street, performs well,
this translates into higher Personal Income Tax revenues.
Another source of revenue highly influenced by regional growth trends
is the Sales Tax. Sales Tax revenues have been growing rapidly in the New
York City region, over the last five years. However, as can be seen in
Figure 9, growth in taxable sales outside New York City lags the growth
in New York City, in recent years. This can also be an indicator that while
economic growth in Metropolitan New York is fairing well, other areas of
the State are not experiencing the same level of growth.
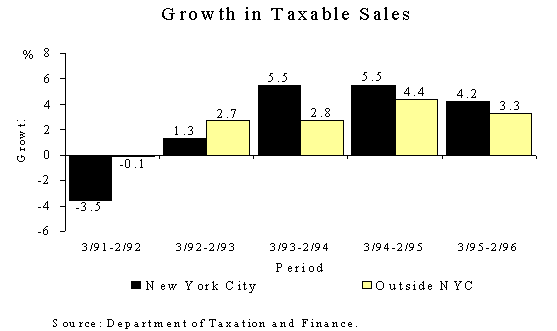
Figure 9
Clearly, the growth in taxable sales in New York City has far out-paced the growth in the rest of the State. While the rest of the State has seen only a maximum growth rate of 4.4 percent over the past four years, during the same time New York City has seen growth rates over 5.5 percent. However, during economic slowdowns, New York City is also much more susceptible to large drop-offs in taxable sales. From March 1991 to February 1992, New York City saw a decrease in taxable sales of over 3.5 percent while the rest of the State measured a decrease of just over 0.1 percent. The following year, as the State was beginning to come out of the recession, New York City still lagged the rest of the State by almost 1.5 percentage points.
Another economic factor which affects Sales tax revenues is the growth
in employment. As New York State employment increases, more individuals
will be taking home paychecks regularly, thereby increasing the level of
household income. From this, households will increase their consumption
expenditures, which in turn will increase Sales Tax revenues. Figure 10
displays the direct relationship between employment and Sales Tax revenues.
As the economy expands, consumers become more confident and tend to spend
more of their household income than they ordinarily would have. This translates
into increased Sales Tax revenues.
Figure 10

As depicted in Figure 11, for an adjusted 1996-97 State Fiscal Year, New York State’s actual revenue growth of 2.1 percent was below average, mainly due to the large tax reductions enacted in the State in previous years. Absent these legislative changes, New York State would have experienced receipt growth of approximately 9.0 percent, slightly outpacing the national economy.4
Driving this increase in state revenues is the continued economic expansion,
which is now into its 84th month. States in all regions of the country
have enjoyed increased levels of employment, personal income and wages,
all of which contribute heavily to increased tax revenue. States that rely
heavily on personal income taxes tend to experience large revenue increases
due to growth in these economic variables.
4. The Center for the Study of the States notes that
these estimates will vary from other figures. Figures are based on
a July 1 - June 30 Fiscal Year, they include impacts of prior years' legislation,
only net effects are measured, and includes amnesties and refunds.