| New York State |
March 2002
|
|
|
Economic Report March 2002 |
|
|
|
| Sheldon Silver, Speaker | Herman D. Farrell, Jr., Chairman |
 New York State Assembly Ways and Means Committee Staff |
|
|
|
|
ASSEMBLY WAYS AND MEANS COMMITTEE HERMAN D. FARRELL, JR. CHAIRMAN MAJORITY MEMBERS |
|
|
|
|
|
ARTHUR O. EVE JOSEPH R. LENTOL ALEXANDER B. GRANNIS IVAN C. LAFAYETTE ROBIN L. SCHIMMINGER CLARENCE NORMAN, JR. WILLIAM L. PARMENT SAMUEL COLMAN RONALD J. CANESTRARI
THOMAS P. DINAPOLI DAVID F. GANT HELENE E. WEINSTEIN |
RONALD C. TOCCI DEBORAH GLICK GLORIA DAVIS CATHERINE T. NOLAN BRIAN M. MCLAUGHLIN JAMES GARY PRETLOW ROGER L. GREEN WILLIAM COLTON RUBEN DIAZ, JR. ADRIANO ESPAILLAT N. NICK PERRY |
|
|
|
|
March 4, 2002 |
|
|
Dear Colleagues: I am pleased to provide you with the NYS Assembly Ways and Means Committee New York State Economic Report. This report is part of our commitment to presenting clear and accurate information to the public. It offers a complete and detailed assessment of the national and State economies. The terrorist attacks of September 11, 2001, continue to have a significant effect on the economy throughout the United States and especially in New York City and New York State. In addition to the tragic loss of human capital, destruction of property, and short-term disruption of business activity, the attacks also have wide-ranging long-term economic effects. Some of these long-term effects may be economically beneficial; many have not yet become evident. The Ways and Means Committee staff projects growth of 1.5 percent in the national economy during 2002. Quarterly economic growth is expected to accelerate in the second and third quarters of the year. In New York State, wages are expected to grow by only 0.7 percent, the lowest rate of growth since 1991. Employment is expected to decline by 0.7 percent in 2002, the lowest rate of growth since 1992. The Ways and Means Committee staff projections are reviewed by an independent panel of economists, including professionals from major financial and manufacturing corporations and prestigious universities, as well as private forecasters from across the State. Assembly Speaker Sheldon Silver and I would like to express our appreciation to all of the members of our Board of Economic Advisors. Their dedication and expert judgement have been invaluable in helping the Committee staff refine and improve this forecast. They have served to make the work of the staff the best in the State. Of course, they are not responsible for either the numbers or the views expressed in this document. I wish to acknowledge the fine work done by the talented Ways and Means Committee staff. Their forecasts are integral to the budget process. The Speaker and I look forward to working with each of you to achieve a budget that is fair for all New Yorkers. |
|
|
Sincerely, Herman D. Farrell, Jr. Chairman |
|
|
|
|
|
NEW YORK STATE ECONOMIC REPORT March 2002
Sheldon Silver
Herman D. Farrell, Jr.
Prepared by the
Dean A. Fuleihan |
|
|
|
|
|
Roman B. Hedges Deputy Secretary |
Kristin M. Proud Deputy Secretary |
|
|
|
|
Edward M. Cupoli Chief Economist/Director of Research |
Steven A. Pleydle Director of Tax & Fiscal Studies |
|
|
|
|
Effect of the September 11 Attack on the Nation
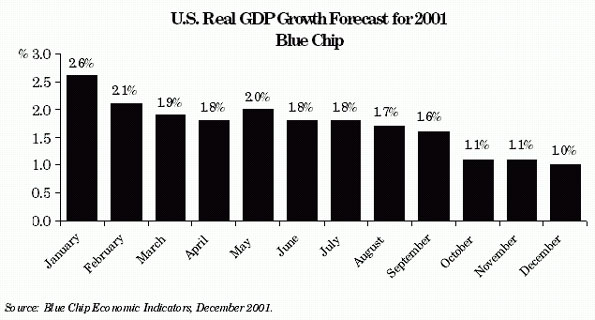 Figure 1
1 According to the National Bureau of Economic Research's Business Cycle Dating Committee, "Before the attack, it is possible that the decline in the economy would have been too mild to qualify as a recession. The attack clearly deepened the contraction and may have been an important factor in turning the episode into a recession," see "The NBER's Business-Cycle Procedure," Business Cycle Dating Committee, National Bureau of Economic Research, January 10, 2002, p. 7. |
|
|
|
United States Economic Forecast
|
|
Table 1 |
|
U.S. REAL GDP FORECAST COMPARISONS
(Percentage Growth Rates) |
||
| 2002 | 2003 | |
| Blue Chip Consensus | 1.5 | 3.5 |
| Ways and Means | 1.5 | 3.7 |
| Division of the Budget | 0.4 | 3.4 |
| DRI-WEFA | 1.0 | 4.0 |
| Economy.com | 1.3 | 4.0 |
|
Source: Economy.com "Regional Financial Review," February 2002; DRI-WEFA "U.S. Executive Summary," February 2002; NYS Assembly Ways and Means Committee staff; Blue Chip Economic Indicators, February 2002; and NYS Division of the Budget, Executive Budget 2002-03, Appendix II, January 2002. |
||
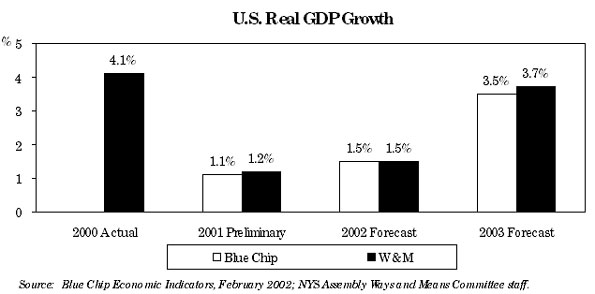 Figure 2 |
|
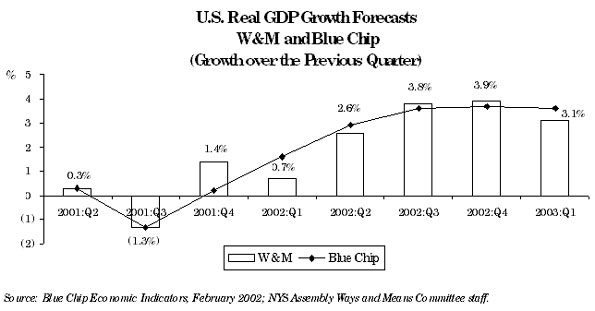 Figure 3 |
|
2 The Bureau of Economic Analysis revised real GDP on February 28, as this report was going to print. The numbers for 2001 reflect this change. The growth rates in the forecast were also changed to reflect the revised levels. However, the forecast was not rerun to reflect this new data. This revision would probably raise the first quarter's GDP growth rate. |
|
|
Effect of the September 11 Attack on New York
|
|
|
|
 Figure 6 |
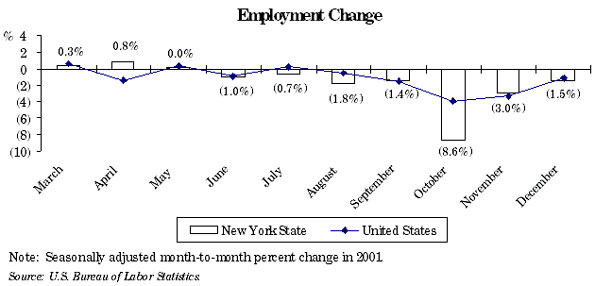 Figure 7 |
|
3 "Working Together to Accelerate New York's Recovery," February 11, 2002-update of the New York City Partnership's "Economic Impact Analysis of the September 11 Attack on New York," November 15, 2001. 4 Office of the Comptroller, the City of New York, Economic Notes, August 2001. 5 Low and high estimate from "Rebuilding Wall Street," Dow Jones Newsletter, November 7, 2001; and "Financial Impact of the World Trade Center Attack," DRI-WEFA, January 2002. 6 NYS Assembly Ways and Means Committee staff estimates from NYS Department of Labor data. |
|
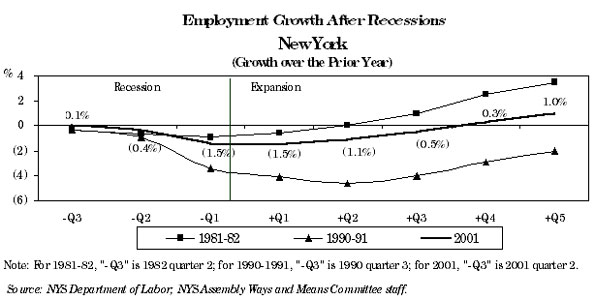 Figure 8 |
|
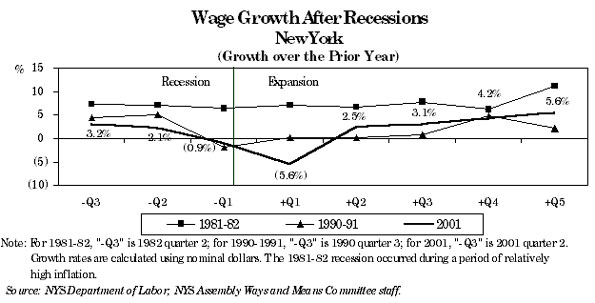 Figure 9 |
|
| Table 2 |
|
NEW YORK STATE FORECAST COMPARISONS (Percentage Growth Rates) |
||||||
|
|
Preliminary 2001 |
Forecast 2002 |
Forecast 2003 |
|||
| Employment | ||||||
| Ways and Means | (0.1) | (0.7) | 1.8 | |||
| Division of the Budget | 0.1 | (1.2) | 0.9 | |||
| DRI-WEFA | 0.7 | (0.6) | 1.0 | |||
| Economy.com | 0.7 | (1.1) | 1.5 | |||
| Wages | ||||||
| Ways and Means | 3.9 | 0.7 | 5.6 | |||
| Division of the Budget | 3.6 | (1.5) | 4.4 | |||
| DRI-WEFA | 7.6 | 4.3 | 4.5 | |||
| Economy.com | 5.3 | 1.2 | 5.0 | |||
|
| ||||||
|
"Source: NYS Assembly Ways and Means Committee staff; DRI-WEFA,
|
||||||
|
|
|
ECONOMIC FORECAST AND THE EFFECT OF THE SEPTEMBER 11 ATTACK |
|
HOW THE ATTACK AFFECTS THE ECONOMY The United States Economy Prior to the Attack Prior to September 11, 2001, the U.S. economy was already struggling. U.S. Gross Domestic Product (GDP) was stagnant (in real terms or inflation-adjusted dollars) even before the September 11 terrorist attack. In addition, GDP growth had rapidly decelerated in the three quarters prior to the attack. Economic weakness had been part of a larger global downturn, making it unlikely that worldwide demand would help to turn the national economy around. Despite these signs of weakness, just before the attack most economists expected economic growth to start picking up some time in the second half of 2001.7 Although the Blue Chip Consensus GDP forecast had declined throughout the year, the October consensus forecast taken just after the September 11 attack shows a particularly strong drop (see Figure 10). This drop is particularly dramatic given that initial readings for GDP growth in the first half of the year had been known for some time. 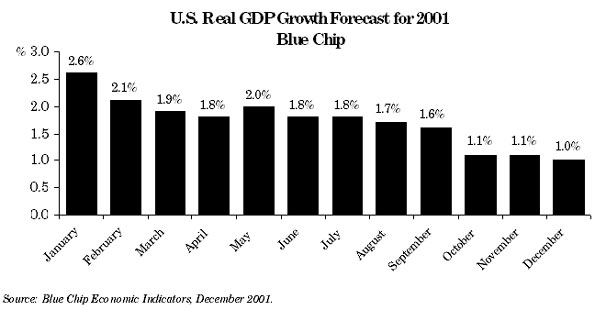 Figure 10 |
|
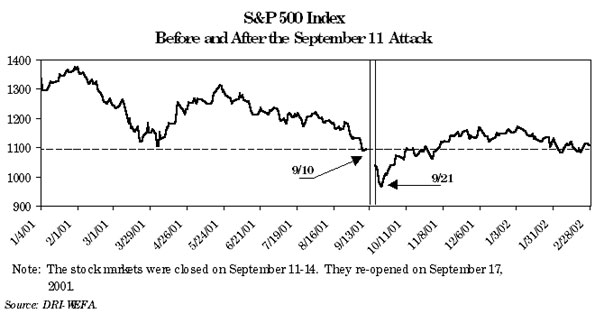
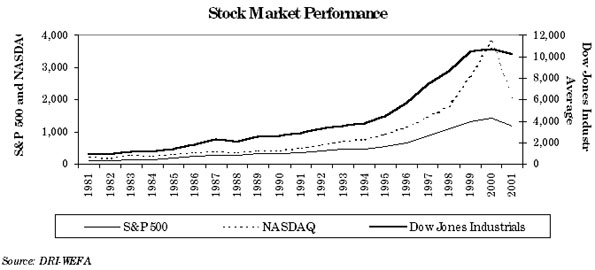
The economic outlook in September just before the terrorist attack was already significantly worse than most economists had expected in the beginning of the year. One good barometer of business expectations is the performance of the stock market, which had shown a downward trend since late 2000 (see Figure 11).
The entire net stock price drop experienced in 2001 occurred before the terrorist attack. Since September 11, even including the record drop in the first week of trading, stock prices have increased overall. This downward stock price trend before the attack reflected a decline in expectations regarding the business environment that began long before September 11. After reaching a low point on September 21, 2001, the stock market rapidly rebounded to pre-attack levels. |
|
7 With the benefit of hindsight, the start of the current recession was dated much earlier than September 11. Members of the National Bureau of Economic Research who date recessions place the start of the current recession as March 2001. |
|
|
|
Causes and Nature of the Current Recession In addition to the September 11, 2001, attack, there are several other factors contributing to the current recession. The current recession was triggered at least in part by a decline in investment. Preparation for Y2K had driven up technology investment, and a subsequent bubble continued that trend even though no major glitches were found. However, this bubble eventually burst in late 2000 and 2001. High oil prices in late 2000 and early 2001 also reduced corporate profits and, therefore, decreased investment activity. Also contributing to the current recession was an ongoing decline in the manufacturing sector. The decline in the stock market since late 2000 was a dramatic shift from a strong upward trend in the late 1990s and in early 2000. The drop in stock prices in 2001 may reflect a correction from what Federal Reserve Chairman, Alan Greenspan, has called "irrational exuberance" in the stock market.8 This market correction and the shift in investor confidence it implies may have in part been responsible for the current recession. Self-fulfilling psychological momentum is an important cause of this recession and others. Talk of an economic downturn or possible recession was growing since late 2000. The September 11 attack caused a psychological (as well as physical) shock that created an expectation of an economic decline. This psychological shock reduced business investment and affected consumer behavior. Fortunately, there are some positive factors that differentiate the current recession from prior recessions. First, it is important to note that the banking system remains strong. Banking institution closures during the 1990-91 recession had helped to extend the recession, but that is not expected to occur now. Oil prices were also an important causative factor in the 1980-81 recession and the 1973-75 recession. This time, low oil prices should help to buoy the economy. Stimulative monetary and fiscal policy will also be important in expediting a recovery. Monetary policy in particular has been extremely stimulative with an unprecedented eleven consecutive rate cuts implemented in 2001. Perhaps the most positive factor differentiating the current recession from prior recessions is that it may end up being the shortest and mildest on record. In late February 2002, it was reported that most economists (60 percent) on the National Association for Business Economics Forecasting Panel believe the recession is already over.9 |
|
8 "Irrational exuberance" refers to stocks trading at very high multiples of price relative to earnings. 9 "Economists: Recession May Already Be Over," USA Today, February 22, 2002. |
|
|
|
How the September 11 Attack Affects the State and National Economy The September 11 terrorist attack affected the economy at two basic levels. At a national level, there has been a large macroeconomic effect that is distinct from any physical damage from the attack. Across the country, transportation and production were disrupted, reducing output even where no physical damage occurred. Safety concerns and changing airline security procedures along with reduced general economic activity has led to reduced spending on airlines, hotels, and travel in general. Even outside of these sectors, consumer behavior in general has been affected. Lower consumer confidence led to reduced spending. Although the largest macroeconomic impact was on the demand side of the economic equation, production has also been affected by the attack. Due to the uncertain environment, business investment declined. In addition, a pre-occupied workforce hurt productivity. All these factors combined have resulted in a drag on the economy as an indirect result of the attack. As stated in The New York Times, "All these changes since September 11-like every decision to cancel a business trip or a vacation, or to hold off on a factory expansion or a kitchen renovation-add up to an uncertainty tax on the economy."10 In addition to any generalized economic effect, there is also the local disruption resulting directly from the attack on the World Trade Center. This includes the loss of lives, capital, and jobs as well as long-term disruption to transportation and other activity over a vital part of Manhattan. It is important to note that though the economy was experiencing weakness prior to September 11 and the recession was determined to have started in March, the attack may have intensified and lengthened the decline in the economy enough to turn it into an official recession. 11 The Assembly Ways and Means Committee staff forecast assumes that the September 11 attack caused an economic shock that turned a mild slowdown and possible recession into a more pronounced and extended decline. However, it is possible that the attack caused a permanent shift in the structure of the New York State economy, not unlike the shift in the early 1970s prompted by rapidly rising oil prices. The desirability of property in high-rise structures, or living/working in Manhattan in particular, may have permanently changed. Consumer attitudes towards airline transportation and travel may have taken a long-term shift. The securities industry may continue to migrate away from its traditional Manhattan center. Transportation, utilities, buildings, and infrastructure may not rebound readily, leading to more business and residential migration away from Manhattan. These issues may present less of a risk to the forecasting period than to the longer-term outlook for New York State. However, they present an important risk that must be recognized. It should also be recognized that even in the short term, the economic environment includes a much higher level of uncertainty than in a typical forecasting period due to the national economic shock as well as the local disruption from the September 11 attack. This economic report is intended primarily to be a forward-looking document. Since almost half a year of post-attack economic activity and the attack itself are now part of history, the focus of this report is on forecasting the future of the economy rather than precisely decomposing what portion of the drop in economic activity between September 11 and today was caused by the attack versus the normal business cycle. However, prior unpublished analysis by the Ways and Means Committee staff suggests that roughly forty percent of the national GDP slowdown in 2001 was attributable to the events of September 11. For New York State variables, the effect of the attack is more pronounced, with about sixty percent of the drop in wages and eighty percent of the drop in employment for 2001 being attributable to the September 11 attack rather than a pre-existing economic slowdown (see Figure 12). |
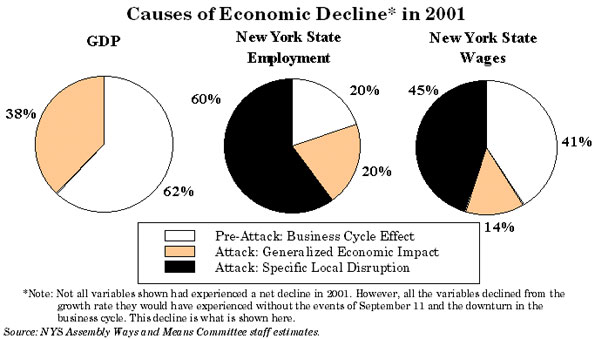 Figure 12 |
|
10 "Risk Managers Face Challenge of Bracing for the Unimaginable," Saul Hansell and Joseph B. Treaster, The New York Times, October 20, 2001. 11 According to the National Bureau of Economic Research's Business Cycle Dating Committee, &qout;Before the attack, it is possible that the decline in the economy would have been too mild to qualify as a recession. The attack clearly deepened the contraction and may have been an important factor in turning the episode into a recession," see "The NBER's Business-Cycle Dating Procedure," Business Cycle Dating Committee, National Bureau of Economic Research, January 10, 2002, p. 7. |
|
|
|
Effect of the Terrorist Attack on Travel-Related Industries Consumer demand has likely been most affected from the terrorist attack in the airline and travel industries. Airline travel experienced several effects from the attack. Air travel during the week of the attack was disrupted, causing a short-term reduction in output for this industry. In addition, demand for airlines has been reduced due to concerns for airline safety and due to at least a short-term change in the consumer's propensity to spend on non-necessity items such as vacations. Airline demand was also affected by increased security measures that often make travel less convenient and more time consuming. In addition, airline cutbacks reduced the flexibility and availability of airline flights. National Travel Airline demand in terms of revenue passenger miles was flat for the first eight months of 2001 compared to 2000 (see Figure 13). In September, revenue passenger miles declined a sharp 31.7 percent. However, it should be noted that airline demand has partially recovered from the low-point just following the terrorist attack. By December, airline revenue passenger miles were down 13.6 percent from the 2000 level. In addition, the number of flights was reduced by a similar amount, reducing airline costs along with revenues. The federal government has already approved $5 billion in grants and $10 billion in loan guarantees to aid the airline industry. This may compensate for the effect of the attack; however, it is important to note that the airlines were already suffering from a difficult year prior to September 11. Although revenue passenger miles did not decline from January to August compared to the prior year, this was only after the average airline price was reduced by 5 percent. At the same time, jet fuel and labor costs were up over 2000 levels, squeezing profits in an industry that traditionally has operated on thin margins. Some of the trouble in this industry came from sources other than the September 11 attack. |
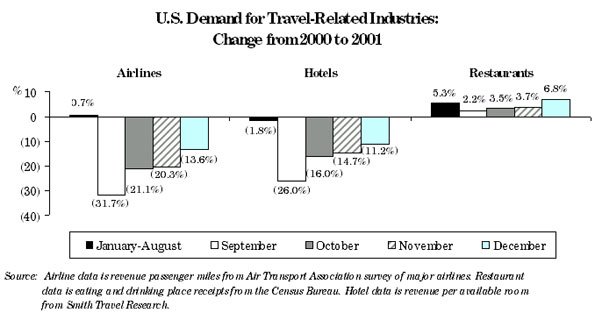 Figure 13 |
|
Hotels suffered secondary effects from the reduction in airline travel. Hotel spending on the part of consumers was also directly impacted by reduced vacation travel following the attack. Unlike the airlines which were directly disrupted the week of the attack, the nation's hotel revenue actually bottomed out the week after the attack (see Figure 14). It is possible that people stranded in hotels due to airline stoppages the week of the attack also helped to mitigate some of the drop in hotel revenue for the week of September 9-15 when compared to the larger drop for the week of September 16-22. Hotel revenue, like the airlines, shows a deep bottom followed by a rebound. Hotel revenue per available room was already down from the 2000 level in the first week of September, before the attack. When viewed at a weekly level, hotel revenue per available room has already rebounded nearly to the pre-attack level. Unlike hotels and airlines, the effect of the attack on national restaurant revenues was minimal. Restaurant revenue across the country was actually up for the full month of September 2001 compared to the same month in 2000. However, the restaurant revenue growth rate dropped temporarily from the 5 percent growth rate experienced in the first eight months of the year. |
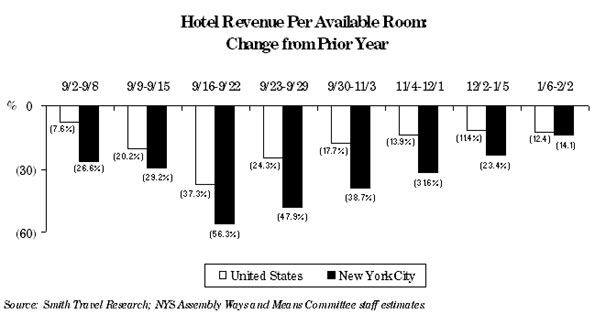 Figure 14
|
|
New York City Hotels and tourism in New York City are a special situation. Some hotels housing displaced businesses and residents had occupancy rates of 80 to 90 percent just after the attack, while others had been hit harder than the rest of the nation. Overall, relative to 2000, revenue per available room is lower in New York City than in the rest of the nation. The drop in New York City is two to three times as large as the nation in some periods. However, this is due to economic conditions existing before the attack. Revenue per available room in the City was down 27 percent compared to the prior year even before the attack. About the same time as the rest of the nation, revenue per available room in the City rebounded to pre-attack levels. |
|
|
|
UNITED STATES ECONOMIC FORECAST |
|
The NYS Assembly Ways and Means Committee staff forecasts that the national economy, as measured by U.S. Real Gross Domestic Product (GDP), will grow 1.5 percent during 2002 (see Table 3, page 10). The current national recession is predicted to be short and mild, with economic growth starting to accelerate as early as the second quarter of this year. Growth will then stabilize between 3.1 and 3.9 percent (see Figure 15).12 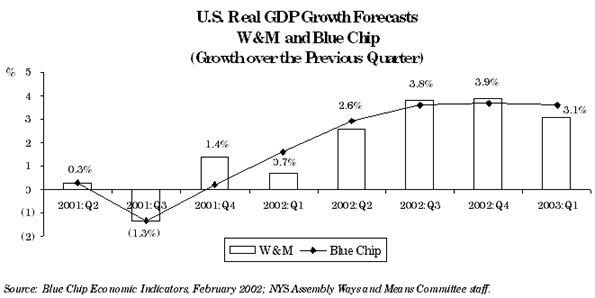 Figure 15 |
|
12 The Bureau of Economic Analysis revised real GDP on February 28, as this report was going to print. The numbers for 2001 reflect this change. The growth rates in the forecast were also changed to reflect the revised levels. However, the forecast was not rerun to reflect this new data. This revision would probably raise the first quarter's GDP growth rate. |
|
Consumption The Ways and Means Committee staff forecasts that consumption spending will decelerate year-over-year to 1.9 percent during 2002 (see Figure 16), down from the 3.1 percent expected for 2001 and 4.8 percent in 2000. 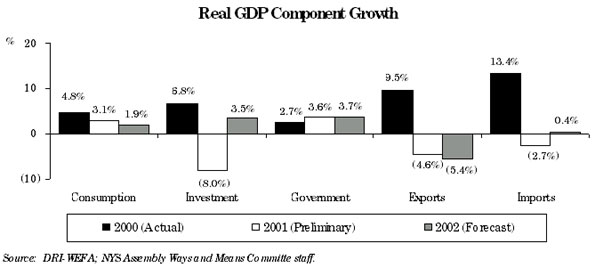 Figure 16 |
|
Table 3 |
|
UNITED STATES ECONOMIC OUTLOOK
(Percent Change) |
|||
| Actual | Preliminary | Forecast | |
| 2000 | 2001 | 2002 | |
| Real GDP | 4.1 | 1.2 | 1.5 |
| Real Consumption | 4.8 | 3.1 | 1.9 |
| Real Investment | 6.8 | (8.0) | 3.5 |
| Real Exports | 9.5 | (4.6) | (5.4) |
| Real Imports | 13.4 | (2.7) | 0.4 |
| Government | 2.7 | 3.6 | 3.7 |
| Federal | 1.7 | 2.7 | 5.2 |
| State and Local | 3.2 | 4.0 | 2.9 |
| Personal Income | 7.0 | 4.9 | 2.8 |
| Wages & Salaries | 8.2 | 5.4 | 2.6 |
| Transfer Income | 4.9 | 7.5 | 6.6 |
| Profits | 8.9 | (16.1) | 8.2 |
| Productivity | 3.4 | 1.7 | 2.0 |
| Employment | 2.2 | 0.4 | (0.4) |
| CPI-Urban | 3.4 | 2.8 | 1.5 |
| S&P 500 | 7.6 | (16.5) | 2.7 |
| Treasury Bill Rate (3 month)* | 5.8 | 3.4 | 2.1 |
| Treasury Bond Rate (10 year)* | 6.0 | 5.0 | 5.1 |
|
* Annual average rate. Source: DRI-WEFA; NYS Assembly Ways and Means Committee staff. |
|||
|
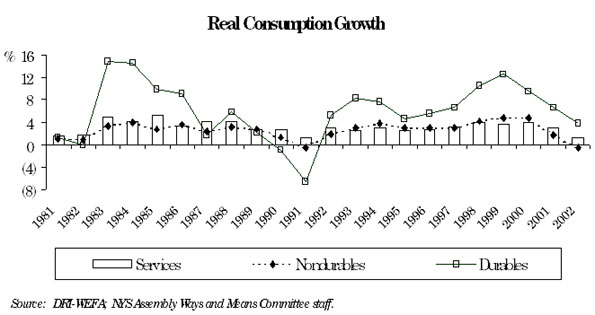
Services consumption, the least volatile as well as largest component of consumption (about 56 percent of the total), is forecast to rebound quarter-to-quarter at a 1.7 percent growth rate by the fourth quarter of 2002. On the other hand, nondurable goods consumption is expected to be sluggish throughout 2002. Despite the fourth quarter spurt in automobile spending driven in part by zero percent financing offers (see Figure 20, Page 14), durable goods consumption is not expected to start recovering until the second half of 2002. A good part of the increase in auto sales may have been a change in timing of sales pushed forward due to attractive financing. This may come at the expense of reduced auto sales in 2002. Although durable goods consumption is the smallest component of consumption (14.5 percent), it has historically been the most volatile (see Figure 17).
As indicated in Figure 18, consumer expectations is correlated with GDP growth. Consumer expectations has rebounded recently, after declining both before and after the September 11 attack.13 |
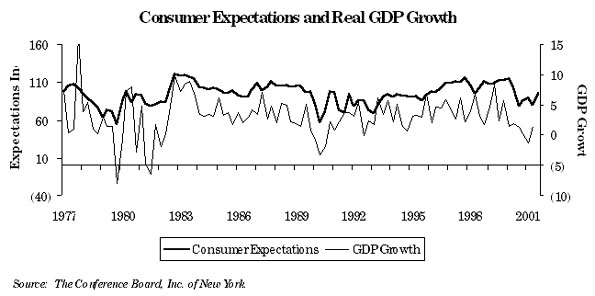 Figure 18 |
|
A reduction in the rate of growth of consumer spending will in part be driven by uncertainty on the part of consumers and a desire to protect against this uncertainty. Given the September 11 attack and the more recent anthrax attacks, many consumers may be taking a war scenario mentality, curtailing discretionary purchases and turning their focus away from consumption. Consumers have historically been skittish when a war first starts. However, consumer spending strengthens as consumers adjust to a war environment. In fact, consumer spending is on average stronger during war years than during non-war years, and the last year of a war in particular has historically had strong spending (see Figure 19). |
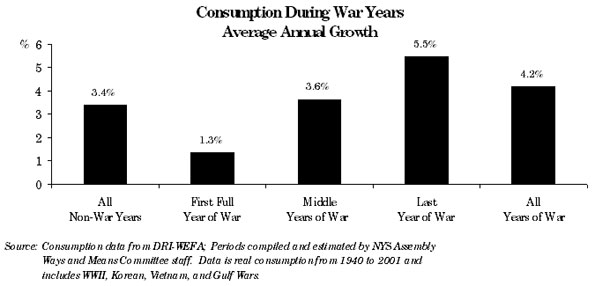 Figure 19 |
|
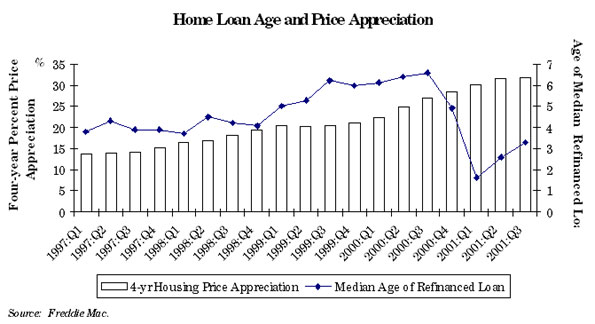
It is important to note that the choices made by consumers-and by businesses as well-are driven by their perceived risk rather than by an objective scientific risk assessment. Several factors are at play here that are known to significantly distort public risk perception. First, risks that receive significant media attention are generally perceived to be more likely to occur than those that do not. Second, risks that are uncontrollable are generally perceived to be more likely than those that are controllable (people, for example, may feel out-of-control when trapped in a tall building or an airplane perceived to be at risk of attack). Third, recency of an event is correlated with its perceived risk. And finally, decision-makers tend to pay more attention to risks that are novel or unknown or that have catastrophic potential.14 All of these factors together act to increase the perceived risk of a future terrorist attack, amplifying the effect of the attack on consumer behavior. Consumer spending will be helped by moderate expected growth in wages and salaries despite a slight decline in employment. There is some anecdotal evidence that union expectations and final agreements continue to include strong wage growth despite the economic downturn. Consumption behavior in 2002 may also depend on what happens in the housing market. Consumption appears to be more correlated with real estate wealth changes than changes in other forms of household wealth. Expected low-interest rates may result in more refinancing which gives consumers an opportunity to cash out this wealth.15 However, due to heavy refinancing activity already occurring in recent years, there may be less wealth here accessible to cash out. Much may depend on whether housing prices appreciate in 2002. In 2001, $1 trillion of mortgage debt was refinanced. Fannie Mae estimates that the record refinancing in 2001 included about $80 billion in cashed-out equity which in turn led to about $50 billion in additional consumer spending.16 The Mortgage Bankers Association predicts that $500 billion more will be refinanced in 2002.17 In 2001, the housing market remained surprisingly strong. Though the year-over-year growth in housing starts took a brief dip in October, late 2001 was actually stronger than early 2001 (see Figure 20). |
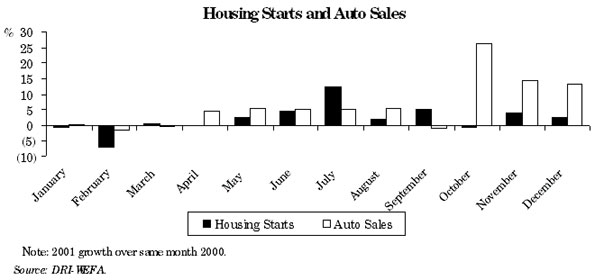 Figure 20 |
|
13 Consumer expectations is a component of consumer confidence, produced by The Conference Board, Inc. of New York. Consumer confidence and consumer sentiment (by the University of Michigan) are two separate survey measures that each try to tap into the economic outlook and spending plans of consumers. Both are linked to consumption and, therefore, GDP. Consumer confidence and sentiment have been found to be useful in forecasting future consumption, even after controlling for lagged consumption and macro variables. They are also highly correlated with each other. 14 Studies that have found an association with mass media coverage include "The Influence of Mass Media and Interpersonal Communication on Societal and Personal Risk Judgments," Cynthia-Lou Coleman, Communications Research, 1993, Vol. 20, Issue 4, pp. 611-629; and "Lay Foibles and Expert Fables in Judgments About Risks," Process in Resource Management and Environmental Planning, Fischhoff, et.al., T.D. Riordan & R.K. Turner (eds.), New York: Wiley, 1987. Studies that have found an association with perceived control of an event include, "The Optimism Bias and Traffic Accident Risk Perception," Accident Analysis and Prevention, D. De Joy, 1989, Vol. 21, pp. 333-340; and "Unrealistic Optimism About Susceptibility to Health Problems: Conclusions from a Community-wide Sample," Journal of Behavioral Medicine, N. D. Weinstein (ed.), 1987, Vol. 10, pp. 481-500. Studies regarding unusual or catastrophic events include "Behavioral Decision Theory Perspectives on Protective Behavior," Taking Care: Understanding and Encouraging Self-protective Behavior, P. Slovic et. al, N. D. Weinstein, (ed.), Cambridge: Cambridge University Press, 1987. 15 This is discussed in detail in "Household Sector Focus: House Prices, Mortgage Refinancing, & Consumer Spending," U.S. Economics Team, Credit Suisse First Boston Corporation, October 11, 2001. 16 "Berson's Housing and Economic Report: January Economic and Mortgage Market Development," Fannie Mae, January 2002. 17 "Stimulus or Not, Hope in the Consumer Economy," David Leonhardt, The New York Times, January 24, 2002, p. C3. |
|
The Ways and Means Committee staff predicts that investment spending, which was declining even prior to the terrorist attack, will grow 3.5 percent year-over-year in 2002, a strong turn-around from the negative 8.0 percent growth expected for 2001 (see Table 3, page 10). This recovery in investment will be mainly due to a sharp increase, after the fourth consecutive quarterly decline, in fixed non-residential investment; to the continued resilience of residential construction; and to a gradual build-up in inventories. A reduced cost of capital will also help to boost corporate profits and lead to increased investment. Information-processing equipment and software investment, which includes computers and accounts for 45.6 percent of total equipment investment, has already started to rebound (see Figure 21) and will continue to come back strongly in 2002. This is in large part due to the fact that most computer equipment is in need of replacement, three years after the over-investment in information technology that took place in preparation for Y2K.18 On the other hand, industrial and transportation equipment investment is predicted to be relatively sluggish until the third quarter. Overall, equipment investment will grow at an annual rate of 6.1 percent in the second quarter of 2002, reaching a 12 to 15 percent growth rate throughout 2003. |
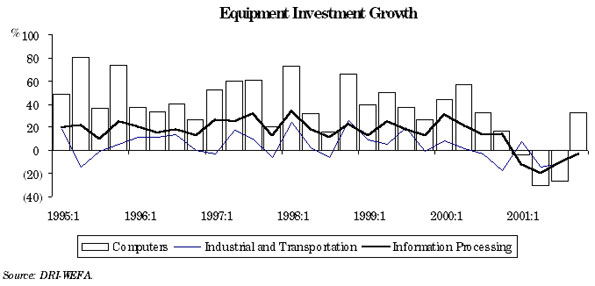 Figure 21
|
|
Residential construction is expected to remain strong throughout 2002, growing 4.9 percent for the whole year. Although rebuilding resulting from the attack will eventually lead to an increase in non-residential construction spending, it is assumed that a large part of the reconstruction expenditures will not occur until 2003. In addition, the impact of this construction spending will have a much larger impact on the New York City area than on the U.S. economy. |
|
18 Regional Financial Review, Economy.com, December 2001. |
|
An increase in government spending will partially offset the negative effects of the terrorist attack. This increased spending comes in the form of both spending on defense, national, and homeland security, and aid primarily directed toward New York. The federal government approved a $40 billion emergency spending authorization shortly after the attack and an additional $15 billion in assistance to the airline industry, including $10 billion in loan guarantees (much of which may not ultimately be utilized). The increased spending assumed in the economic forecast includes spending on national security such as national guard/reserves and Pentagon reconstruction, as well as state and local government spending related to the attack. The Committee staff forecasts that federal government spending19 will grow 5.2 percent in 2002, after 2.7 percent growth in 2001; while state and local government spending will grow 2.9 percent in 2002, after 4.0 percent growth in 2001. Aggregate government spending will grow by 3.7 percent in 2002, a little higher than the 3.6 percent in 2001. |
|
19 Federal government spending as defined in GDP expenditures includes the goods and services purchased by the federal government. This includes employee compensation, but not social security or other transfers made by the government. Using this definition, total federal government expenditures are roughly $600 billion, with over 60 percent of this amount coming from national defense spending. |
|
Both exports and imports have declined during the current recession. Reduced consumption has resulted in fewer imports. However, at the same time, the weakening of the global economy has led to fewer exports. The Committee staff forecasts that real exports will continue to decline year-over-year in 2002 at an even faster rate of 5.4 percent, compared to a decline of 4.6 percent in 2001. Real imports are forecast to grow 0.4 percent year-over-year in 2002, compared to a decline of 2.7 percent in 2001. Net exports, defined as exports minus imports, are an important component of GDP. On balance, net exports will decline in 2002 due both to declining exports and rising imports, negatively affecting GDP. |
|
Employment The September 11 attack has affected U.S. employment. The data for September through December 2001 shows a drop in employment of 1.1 million and an increase in the unemployment rate from 5.0 percent to 5.8 percent (see Figure 22).20 |
|
The Ways and Means Committee staff predicts national employment will decline 0.4 percent in 2002, following a growth of 0.4 percent in 2001. Unemployment, which generally lags declines in economic growth, is expected to peak at 6.2 percent in the second quarter of 2002, bringing the annual average up to 6.0 percent from 4.8 percent in 2001. Construction, services, government, and finance, insurance, and real estate (FIRE) employment are expected to see positive growth in 2002, while manufacturing, transportation and utilities, and trade (both wholesale and retail) will see negative growth (see Table 4).21 |
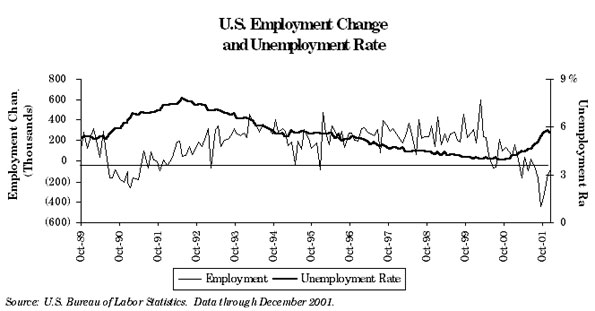 Figure 22 |
|
Table 4 |
|
UNITED STATES EMPLOYMENT BY SECTOR (Percent Change) |
||||||
|
|
Actual 2000 |
Preliminary 2001 |
Forecast 2002 |
|||
|
TOTAL |
2.2 |
0.4 |
(0.4) |
|||
| Services | 3.6 | 1.4 | 0.7 | |||
| Retail Trade | 2.0 | 0.8 | (1.4) | |||
| Government | 2.4 | 0.9 | 1.4 | |||
| Manufacturing1 | (0.5) | (4.2) | (3.7) | |||
| F.I.R.E. | 0.1 | 0.8 | 0.7 | |||
| Utilities2 | 2.7 | 0.7 | (1.8) | |||
| Wholesale Trade | 1.6 | (0.1) | (0.9) | |||
| Construction | 4.5 | 2.5 | 1.0 | |||
|
| ||||||
|
1Including Mining. 2Transportation, Communication, Public Utilities. Source: DRI-WEFA; NYS Assembly Ways and Means Committee staff. |
||||||
|
20 This employment loss figure is based on the sum of monthly changes in seasonally adjusted employment from the previous month for the September to December 2001 period. 21 There will be some positive impact on construction employment long-term due to clean-up, renovations, and rebuilding done by construction workers. However, most of the major rebuilding will not start until late 2002. |
|
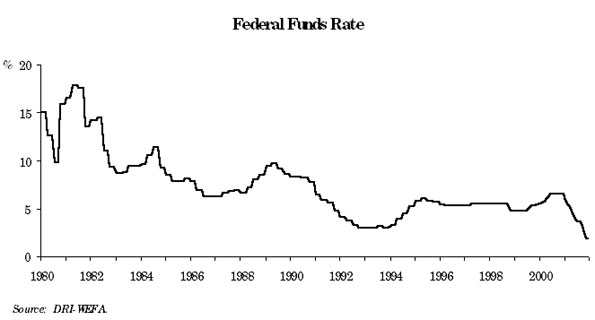
Interest Rates The Federal Reserve has responded to the September 11 attack by aggressively cutting rates and injecting liquidity into the economy. This continued a year-long trend of rate reductions, with the Fed cutting the federal funds rate eleven times from 6.5 percent to 1.75 percent. Three-month Treasury bill rates are expected to gradually rise in 2002 to 2.7 percent by the end of the year. Long-term rates are expected to remain stable, with the ten-year Treasury bond rate averaging 5.1 percent in 2002. The forecast assumes that the Federal Reserve will increase the federal funds rate target from 1.75 percent to 2.50 percent by the end of 2002. |
|
Comparison with Other Forecasting Groups The Ways and Means Committee staff forecast for overall national economic growth in 2002 is 1.5 percent, the same as the Blue Chip Economic Consensus forecast. Economy.com's forecast is 1.3 percent; DRI-WEFA's forecast is 1.0 percent; and the Division of the Budget's forecast is 0.4 percent (see Table 5). The February 2002 Blue Chip Consensus Forecast is the average of 52 forecasters. Twenty-six of these forecasters, or exactly half, have 2002 GDP growth forecasts at least as high as the Committee staff forecast.22 Only one of 52 has a forecast lower than the Division of the Budget's forecast. |
|
Table 5 |
|
U.S. REAL GDP FORECAST COMPARISONS
(Percentage Growth Rates) |
||
| 2002 | 2003 | |
| Blue Chip Consensus | 1.5 | 3.5 |
| Ways and Means | 1.5 | 3.7 |
| Division of the Budget | 0.4 | 3.4 |
| DRI-WEFA | 1.0 | 4.0 |
| Economy.com | 1.3 | 4.0 |
|
Source: Economy.com "Regional Financial Review," February 2002; DRI-WEFA "U.S. Executive Summary," February 2002; NYS Assembly Ways and Means Committee staff; Blue Chip Economic Indicators, February 2002; and NYS Division of the Budget, Executive Budget 2002-03, Appendix II, January 2002. |
||
|
22 It should be noted that the Blue Chip Consensus was published prior to the February 28, 2002, real GDP revision. |
|
NEW YORK STATE ECONOMIC FORECAST |
|
Economic activity in New York State has decreased from the generalized effect of the terrorist attack just like the rest of the nation. Furthermore, New York has experienced additional direct disruption from the attack. |
|
Additional Effects on New York State New York has suffered a significant loss of capital stock (i.e., human capital and property). The skills and knowledge of those individuals tragically killed in the terrorist attack are permanently lost to the economy, causing a loss of human capital originally estimated to be approximately $11 billion.23 The property loss from the attack was initially estimated to be approximately $34 billion.24 However, as more claims have been filed and better information has become available, the estimates of insurable losses have increased from $38 billion to as much as $52 billion. In addition, the decline in the estimated death toll (from roughly 6,000 to just below 3,000) has resulted in roughly a $1.5 billion drop in estimated life insurance and workers' compensation payments.25 The NYS Assembly Ways and Means Committee staff forecast estimates that $11.9 billion in output will be lost from the disruption in 2001 and $15.2 billion more will be lost in 2002.26 According to Cushman and Wakefield, about 20 million square feet of office space was destroyed or damaged by the attack. This represents 5.2 percent of total Manhattan office space. Tenantwise puts this figure significantly higher at 34.5 million square feet destroyed or damaged.27 |
|
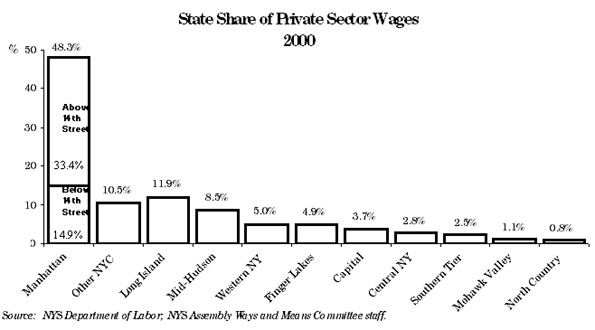
An estimated 18,500 to 31,800 jobs have relocated out-of-state.28 The average wage for private sector workers below 14th Street in Manhattan was $93,753, far higher than any other part of the State and double the statewide average. Most of the relocated jobs are in the securities industry, which had a much higher average wage of $232,223. Therefore, job losses in this area have a dramatic effect on statewide wage growth. The attack has also caused a disruption of normal work activity in New York, thereby reducing output, with about one-third of this reduction coming from the securities industry. In addition, roads and subways were closed and traffic on bridges was slowed by security checkpoints. Some of this disruption may continue for quite some time. This is especially damaging to a region like Manhattan where more than 1.4 million members of the work-force commute from other counties or states.29 It is also important to note that New York is much more sensitive than the rest of the nation to activity in the financial sector. The financial sector has suffered both a direct and indirect effect from the attack. In addition, due to a large portion of bonus income, wages in this sector are particularly volatile. These negative effects for New York State will be partially offset by a disproportionate share of increased federal government spending, insurance claims, and other relief payments coming into the State. In addition to the life and property/casualty insurance received by individuals and businesses from the September 11 attack, areas affected by the attack will be receiving federal aid.30 |
|
23 This and other estimates of the disruption from the attack come from the Office of the Comptroller, the City of New York, "The Impact of the September 11 WTC Attack on NYC's Economy and Revenues," October 4, 2001; NYS Small Business Development Center, October 2001; and New York City Partnership and Chamber of Commerce, "Economic Impact Analysis of the September 11 Attack on New York," November 15, 2001. 24 Office of the Comptroller, the City of New York, "The Impact of the September 11 World Trade Center Attack," September 28, 2001. 25 "Working Together to Accelerate New York's Recovery," February 11, 2002-update of the New York City Partnership's "Economic Impact Analysis of the September 11 Attack on New York," November 15, 2001. In addition, according to testimony at an Assembly hearing on December 12, 2001, in New York City, property and casualty claims are estimated at $48 billion, life insurance claims at $2 to $4 billion. 26 Estimates are partially based on the Office of the Comptroller, the City of New York, "The Impact of the September 11 WTC Attack on NYC's Economy and Revenues," October 4, 2001. The report estimated $25 billion in rents and output lost in 2001 and 2002 combined.
27 Cushman & Wakefield, October 2001; Tenantwise 28 Low and high estimate from "Rebuilding Wall Street," Dow Jones Newsletter, November 7, 2001; and "Financial Impact of the World Trade Center Attack," DRI-WEFA, January 2002. However, more recent reports indicate that at least some portion of those who relocated out-of-state have returned to New York and Lower Manhattan in particular. See "Wall Street Slowly Getting Back to Normal," Rebuilding Wall Street, February 13, 2002. 29 U.S. Census Data (1990 county-to-county worker flow file). 30 The full reimbursement picture is still unfolding, however some reports indicate that the total will be over $10 billion. According to an article from the Associated Press, New York City is to get $10.7 billion for recovery help as part of a compromise $20 billion anti-terrorism package attached to a $318 billion defense measure. The $10.7 billion for New York is a little more than half the $20 billion President Bush promised shortly after the attack and reiterated on February 6, 2002. The White House budget office has said that New York will still receive the full $20 billion-and likely more than that-but not all at once. "New York City to Get $10.7B in Final Deal," Shannon McCaffrey and Alan Fram, Associated Press. First published: December 19, 2001. |
|
Employment The pattern of employment change in New York State shows a sharp drop in October 2001 followed by much smaller declines in November and December (see Figure 23). The decline in United States employment shows a similar pattern, but with a milder trough in October. |
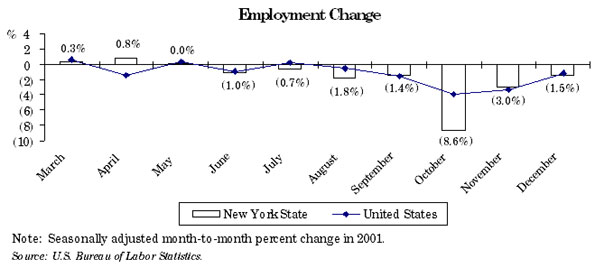 Figure 23 |
|
The Committee staff estimates that in the fourth quarter of 2001 alone the New York economy lost about 125,300 jobs due to general economic slowdown and the disruption caused by the terrorist attack. Other sources also give large job loss estimates from the attack, including 108,000 from Economy.com, 105,000 from the Fiscal Policy Institute, 100,000 from DRI-WEFA, and 105,100 from the New York City Comptroller.31 Average annual employment is expected to decline by 0.7 percent in 2002 (see Table 6). Before the third quarter of 2001, employment growth was slowing in all sectors. Growth was positive but declining for services and construction before the third quarter of 2001. These two sectors are expected to grow further in 2002. Growth was also positive but declining before the third quarter of 2001 for utilities and FIRE. However, these sectors are expected to experience an employment decline in 2002. Manufacturing and trade were already losing jobs by mid-year 2001. These sectors are expected to continue to shed jobs in 2002. Government employment experienced positive growth in the first quarter of 2001, but negative growth in the second quarter of 2001, largely due to the loss of census jobs from 2000. Government employment will see little change in 2002 due to budgetary pressures. |
|
Table 6 |
|
NEW YORK STATE ECONOMIC INDICATORS
(Percent Change) |
|||
| Actual | Preliminary | Forecast | |
| 2000 | 2001 | 2002 | |
| Personal Income | 6.6 | 3.5 | 0.9 |
| Wages and Salaries | 9.9 | 3.9 | 0.7 |
| Total Employment | 2.2 | (0.1) | (0.7) |
| Services | 3.7 | 1.0 | 1.0 |
| Trade | 2.0 | (0.9) | (1.7) |
| Government | 1.6 | (0.1) | 0.1 |
| Manufacturing | (1.8) | (3.9) | (4.4) |
| F.I.R.E. | 0.2 | (1.2) | (2.8) |
| Utilities | 2.9 | (0.3) | (3.2) |
| Construction | 5.7 | 2.7 | 3.7 |
| CPI | 3.1 | 2.6 | 1.6 |
|
Source: DRI-WEFA; NYS Assembly Ways and Means Committee staff estimates. |
|||
|
Employment growth following the current recession is expected to be weaker than after the 1981-82 recession but stronger than after the 1990-91 recession (see Figure 24). 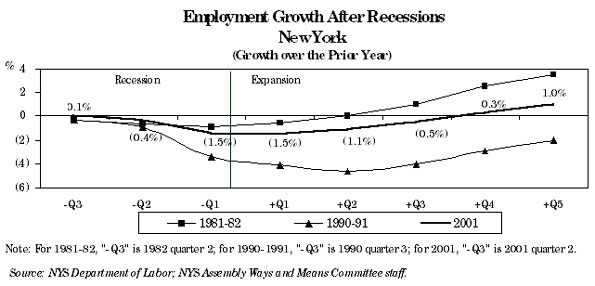 Figure 24 |
|
31 Economy.com, January 2002 report on the New York Metropolitan area; "Economic Impact of the September 11 World Trade Center Attack," Fiscal Policy Institute, September 28, 2001; "Financial Impact of the World Trade Center Attack," DRI-WEFA, January 2002; and New York City Comptroller Press Release, January 2002. In addition, a separate analysis from the City Council said the City will have 126,000 fewer jobs in 2002 as a result of the attack: see "Job Losses from 9/11 Grow: Reports add Thousands to WTC Fallout," Nancy Dillon, New York Daily News, February 12, 2002. |
|
Wages To translate the impact of the terrorist attack on employment to its effect on wages, it is important to note that the wage of the typical worker in the area directly affected by the attack is higher than the average wage rate in the State as a whole. In addition, the most volatile component of wages is bonuses, which plays a particularly important role in wage rates for the financial sector. The decline in the wage growth rate from 2000 to 2001 is larger than the drop experienced during the 1990-1991 recession.32 The Committee staff projects that State wages will grow 0.7 percent in 2002 (see Figure 25). 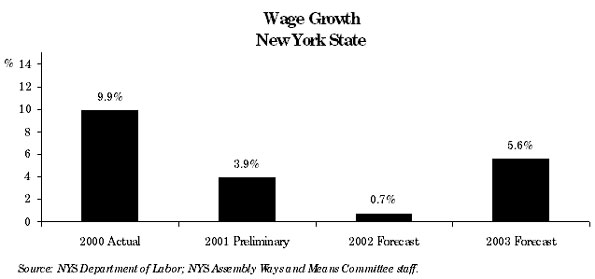 Figure 25 Wage growth is expected to take a sharp drop in the first quarter following the current recession due in part to declining variable compensation. Wage growth thereafter will be similar to the growth pattern following the 1990-91 recession (see Figure 26). 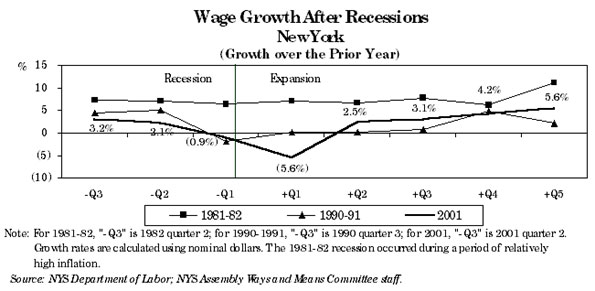 Figure 26 |
|
32 The current wage growth drop is predicted to be 6.0 percentage points from 2000 to 2001 and 9.2 percentage points from 2000 to 2002. In the 1990-91 recession, wage growth dropped 5.4 percentage points. However, in the 1990-91 recession, New York State performed much more poorly than the nation. |
|
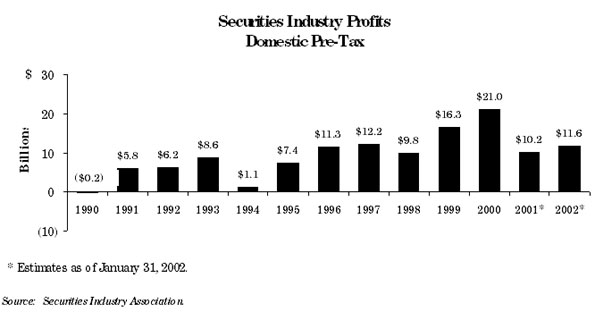
Variable Compensation Securities industry variable compensation is linked with securities industry profits (see Figure 27).33 When industry profits decline as they did in 1990, 1994, and 1998, variable compensation tends to be weak but "sticky" downward. In other words, the decline in variable compensation is generally less severe than the decline in profits. Securities industry variable compensation made up almost half of total variable compensation in New York State in 2000. 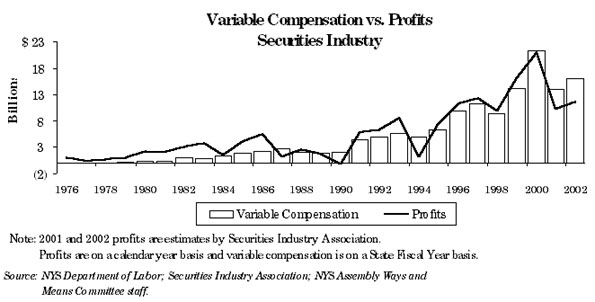 Figure 27 |
|
Variable compensation in the New York State securities industry is expected to go down 34.3 percent during the State Fiscal Year (SFY) 2001-02. Part of this decline is due to smaller bonuses received by securities industry employees still on the payroll in New York State. Another part is due to lower payrolls in New York State from relocations and layoffs.34 Variable compensation in all other sectors is expected to go down 7.8 percent in FY 2001-02. The smaller decline for all other sectors is due to lower historical volatility in variable compensation for these sectors. In addition, securities industry profits are more related to business cycles than other industry profits. It should be noted that uncertainty regarding how much variable compensation will be and how much of this compensation will come in the form of stock options versus cash payments are major risk factors to the Ways and Means Committee staff forecast of New York State wages. The effects of lost property and rents add some additional risk to the wage forecast, since some of the lost rent will show up as wages due to corporate ownership of the properties.35 It should be noted that not all of the productive workforce lost showed up in wages right away. Many workers affected by the attack continued to receive payment from their companies for some time even though they were no longer on the job. Of course, this gain for some wage earners will be lost somewhere else and comes out of the profits of the corporations they work for or insurers. |
|
33 In Figure 27, annual variable compensation is calculated as the sum of fourth quarter and the following year's first quarter variable compensation. 34 While the percentage of workers relocated out-of-state may be higher than this, many relocated securities industry workers did not change their official work location, therefore not all of this variable compensation was lost to the State. 35 Property income is usually considered a distinct component of personal income, separate from wages. However, much of the property in Manhattan is owned by wealthy private owners who choose to incorporate their property ownership in some form to limit their liability. When the property is owned by a corporation that represents a small number of private individuals, the property income will either appear as dividends or wages paid to the owners. Therefore, some of the uninsured property income lost shows up in wages. It is also important to note that rents declined in all areas of Manhattan in September. This occurred despite reduced available office space from the terrorist attack. According to Insignia/ESG (October 2001, Special Report II), rents in downtown Manhattan in September declined $1.26 per square foot, in Midtown they were down $0.52 per square foot, and in Midtown South they were down $1.61 per square foot. |
|
Executive Compensation and Variable Pay The share of employee compensation coming from salary payments has declined over time. The variable components of wages such as bonuses, stock options exercised, and restricted stock have increased. For example, in 1995, salaries accounted for 32 percent of total executive compensation, while in 2000, salaries accounted for only 12 percent.36 Over the same period, compensation from stock options exercised more than doubled from 26 percent to 60 percent (see Figure 28). This trend is not unique to executive compensation. Only one-third of stock options issued to employees were issued to the top five executives. Although precise numbers are harder to obtain, the shift in pay from salary to variable compensation and options has also been occurring in non-executive pay. Committee staff estimates indicate that the variable compensation component of wages and salaries has increased over time for overall workers in New York State. However, due to declining stock prices, options exercised are expected to drop sharply in 2001. It is not clear what direction executive compensation will take in the near future. To some extent, options are less desirable in light of recent stock market declines. At the same time, concerns over what has happened at Enron may lead some companies to reevaluate how they compensate their executives. 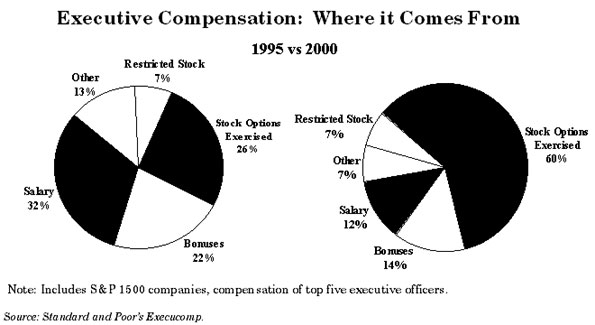 Figure 28 |
|
36 Standard and Poor's Execucomp. |
|
Stock Options The growth of stock options represents a major source of uncertainty for forecasting New York State wages. For companies based in New York, the value of options exercised by the top five executives more than tripled. The value of options granted to these executives quintupled while the value of options granted to all employees increased at an even higher rate.37 Clearly, the importance of options in total wages has grown. According to a Bureau of Labor Statistics survey, 1.7 percent of private industry employees received stock options.38 Although stock options were actually received by a lower portion of employees in the Northeast (1.1 percent), New York probably has a higher dependence on options. Options granted in the finance, insurance, and real estate (FIRE) sector were particularly high (5.1 percent of employees). Options granted were also particularly high for employees in higher pay brackets, with 12.9 percent of employees making $75,000 or more receiving options. This suggests that options may make up a higher portion of wages in New York City than in other parts of the country. Stock options are perhaps the most difficult component of wages to accurately forecast. Like cash bonuses there is no available data source for stock options and like bonuses, options granted are more volatile than other wages. However, in addition to these problems, stock options do not show up as wages until they are exercised; several years after they are granted. Options also have market volatility after being granted in addition to the initial volatility in how many options are granted. In fact, the market volatility of a stock option is much greater than the volatility for a traditional stock purchase. Below a certain stock price, the value of a stock option is zero. Usually, this price will be at least as high as the stock price when the options are issued. Therefore, in periods with a declining market, many employee stock options will have no value. According to a recent survey, 73 percent of options granted are "underwater," meaning they would have no value if exercised today.39 This suggests that the contribution to wages of stock options exercised may drop dramatically in the current environment. |
|
37 Calculations are by NYS Assembly Ways and Means Committee staff based on a sample of Standard and Poor companies from Execucomp. For additional analysis of stock options using the Execucomp Survey, see "The Effect of Employee Stock Options on the Evolution of Compensation in the 1990s," Hamid Mehran and Joseph Tracy, Economic Policy Review, Federal Reserve Bank of New York, December 2001. 38 "Pilot survey on the incidence of stock options in private industry," Bureau of Labor Statistics News, October 11, 2000. The pilot survey only addressed whether or not an employee received options; it did not study the value of those options in proportion to total wages. 39 Survey is by ESOP Direct: "Holders Alive to Underwater ESOPs," Gouri Agtey Athale, The Economic Times, December 27, 2001. |
|
New York State Forecast Comparison The Ways and Means Committee staff's State employment forecast of a 0.7 percent decline in 2002 is 0.1 percentage points lower than the forecast from DRI-WEFA, 0.4 percentage points higher than the forecast from Economy.com, and 0.5 percentage points higher than the Division of the Budget (see Table 7). The Committee staff's 0.7 percent wage growth forecast for 2002 is in the middle of the forecast range. DRI-WEFA is 3.6 percentage points more, at 4.3 percent; while the Division of the Budget is 2.2 percentage points less, at negative 1.5 percent. |
|
Table 7 |
|
NEW YORK STATE FORECAST COMPARISONS
(Percentage Growth Rates) |
|||
| Preliminary | Forecast | Forecast | |
| 2001 | 2002 | 2003 | |
| Employment | |||
| Ways and Means | (0.1) | (0.7) | 1.8 |
| Division of the Budget | 0.1 | (1.2) | 0.9 |
| DRI-WEFA | 0.7 | (0.6) | 1.0 |
| Economy.com | 0.7 | (1.1) | 1.5 |
| Wages | |||
| Ways and Means | 3.9 | 0.7 | 5.6 |
| Division of the Budget | 3.6 | (1.5) | 4.4 |
| DRI-WEFA | 7.6 | 4.3 | 4.5 |
| Economy.com | 5.3 | 1.2 | 5.0 |
|
Source: NYS Assembly Ways and Means Committee staff; DRI-WEFA, February 2002; Division of the Budget, Executive Budget 2002-03, January 2002; Economy.com, Regional Financial Review and unpublished data, February 2002. |
|||
|
RISKS TO THE FORECASTS |
|
Risks to the National Forecast Downside Risk It is important to note that there is greater uncertainty in the current environment than in typical forecasting periods. This would be true in any recessionary period, but it is particularly true since we have had a major economic shock and have the potential for more unexpected events. A major risk to the forecast is how long-lasting any change in consumer behavior will be. If the reduction in consumer confidence does not dissipate over the next several quarters, the downturn will be more prolonged. If there are future terrorist attacks with many casualties or the international conflict escalates, consumption will be adversely affected beyond the numbers used in this forecast. Any prolonged change in consumer behavior, investment behavior, or productivity represents a risk to the forecast. Deterioration in the current electricity and natural gas markets (higher prices coupled with supply shortages and resultant blackouts) would also affect national employment, output, and the price level. Although oil prices are currently relatively low, the Organization of Petroleum Exporting Countries (OPEC) agreed to cut production at their December 28, 2001, meeting and further cuts in supply present a potential risk. The possibility of a weaker world economy also presents a downside risk for our forecast. Japan, in particular, may experience a further decline of the yen. This could lead to currency devaluation in Asia in general and possibly to deflationary pressure in the United States. Deteriorating relations with Iran also present a risk since Iran is a significant player in the world economy. Despite aggressive monetary policy, the economy has been slow to turn around. There are limits to the effectiveness of monetary policy. Long-term rates are determined by market forces, and banks control how much money ultimately gets into the economy by controlling lending standards. In addition, there is a limit on how low the rates the Federal Reserve does control can go. Therefore, if the economy continues to deteriorate, additional monetary policy may not be effective at turning the economy around. Even if evidence of an economic recovery becomes strong in the near future, stock market performance may be hindered by concerns regarding accounting practices. In large part, these concerns have been spurred on by the sudden collapse of Enron. Questionable accounting practices discovered recently at other companies-including Tyco, Elan Corporation, and Providian Financial-have intensified these fears. These concerns could lead to change in accounting practices at other firms to retain investor confidence. This, in turn, could lead to restatements of earnings that may hurt stock prices. Concern about corporate earnings also could lead to a risk of commercial credit tightening.40 In addition, concern by banks regarding consumers presents a potential risk of tightening credit availability in consumer lending as well. |
|
40 In the wake of the Enron bankruptcy, Computer Associates, AES, Tyco, and Quest have all been forced to stop selling short-term commercial paper in February due to questions about accounting practices and debt, according to "Companies Face a Crunch as Investors Fret," Thor Valdmanis, USA Today, February 22, 2002. |
|
Upside Potential There is also an upside potential to the uncertainty regarding consumer spending. If consumer spending rebounds more rapidly, the economy could perform better than assumed in this forecast. A larger-than-expected tax cut would also have a positive impact on the economic outlook. The same holds true for fiscal stimulus through a large, unexpected spending increase. The reinvigoration of the economies of the nation's primary trading partners, particularly the European Union, Canada, and Japan, could result in stronger-than-expected export growth and, hence, stronger U.S. Gross Domestic Product (GDP) growth. |
|
Risks to the New York Forecast Downside Risk A second terrorist attack in the State could cause major disruption to an already-damaged infrastructure, and possibly have a large adverse effect on tourism and the relocation decisions of both residents and businesses. The uncertainty regarding variable compensation is another major risk to the State forecast.41 Variable compensation has been highly volatile. It is also highly focused in certain industries, particularly Wall Street. How these industries adjust their compensation plans to the fallout from the attack, in what form bonuses are paid, and when stock options will be exercised are all difficult to predict. The behavior of Wall Street and the finance, insurance, and real estate (FIRE) sector in general is a risk to this forecast. New York is particularly sensitive to the performance of the FIRE sector and recent events have highlighted the level of uncertainty for this sector in particular. Accurately assessing the negative disruption to Manhattan is a source of significant uncertainty and therefore a risk to the forecast. If costs are higher than expected, this will have a measurable negative impact on the State economy. The timing and magnitude of the economic stimulus from rebuilding and other new activity in Manhattan generated from the attack is also a risk. The response of the government to the needs of the private sector in New York City will be a key variable in determining how the State recovers from the attack. If the State does not get all of the federal aid that has already been promised, this would hurt the State economy beyond what is shown in this forecast. The national economy is one more risk to the New York State forecast. If the national economy slows down more than we have predicted, then our forecast for the State will have been overly optimistic. Any further negative stock market correction could have a similar negative impact on the State economy. |
|
41 There is no known series of data for state or national variable compensation. The NYS Assembly Ways and Means Committee staff estimates variable compensation based on seasonal variations in wage patterns. These seasonal patterns are broken down by sector to improve the precision of the estimate. The growth in this variation over time is also accounted for in the estimate. Since this estimate is based on seasonal variation, it underestimates bonuses and commissions that come at frequent intervals throughout the year. It also underestimates stock options to the extent that they are exercised throughout the year. On the other hand, in some cases non-variable pay may be included in variable compensation if there are regular seasonal patterns (such as if overtime regularly occurs in a certain quarter). Therefore, variable compensation contains high uncertainty-even in terms of the actual history. |
|
Upside Potential Several factors present a possible upside potential to the New York State forecast. Bonuses could stay strong despite the economic decline if firms decide that they still need to maintain high bonuses to retain their key employees. In addition, stronger-than-expected corporate profits could lead to faster stock market growth than predicted, producing in turn higher profits on Wall Street and higher bonus income. The disruption to Manhattan could also be less severe than expected or the positive stimulus from rebuilding could be stronger. A better-than-expected national economy would also improve conditions in the State economy. |
|
ECONOMIC ANALYSIS |
|
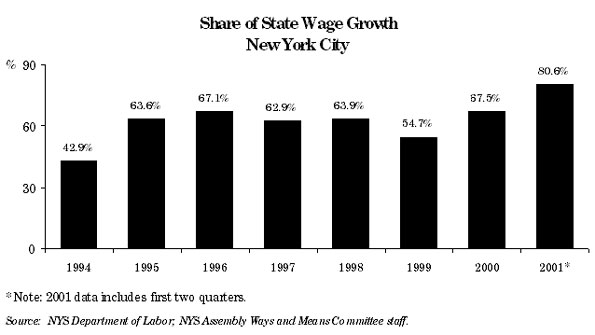
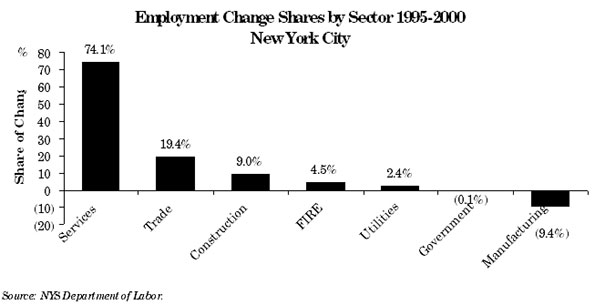
The New York City Economy and the Disruption of September 11 Recent Economic Changes New York City is the largest economic region in the State. The size of the City economy is larger than most nations-only fourteen countries in the world produce more output than New York City.42 The City accounted for about two-thirds, or 69.5 percent, of the State's population increase in the 1990s. Manhattan has an impressive pool of skilled labor-42.2 percent of its population above twenty-five years of age had at least a bachelor's degree in 1990, compared to 23.1 percent for New York State, and 20.4 percent for the United States. New York City accounts for 42.7 percent of all jobs in the State, and 55.5 percent of State wages. The City was the source of 3.6 million jobs in 2000, ranking it first for employment among the ten economic development regions. The service sector is the largest source of employment in the City-38.6 percent of City employment in 2000 came from this sector, and 30.3 percent of all wages were paid in this sector (see Figure 29). The finance, insurance, and real estate (FIRE) sector is prominent in New York City-the world financial center. This sector was the source of 13.4 percent of total employment, and 33.3 percent of total wages. |
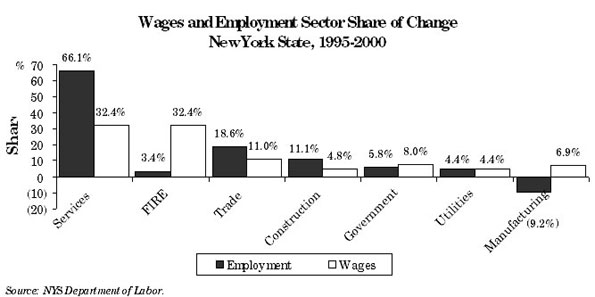
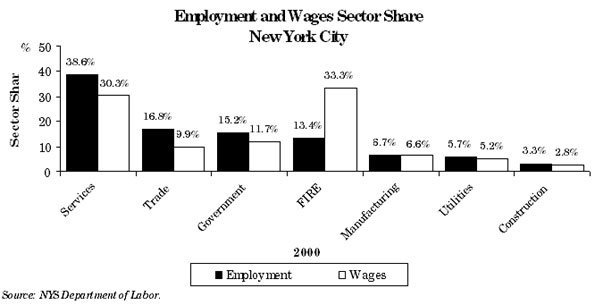 Figure 29 In recent years, employment shifted dramatically from manufacturing to services. Nevertheless, New York City is the largest source of manufacturing jobs in the State. In 2000, the City employed 240,000 people in the manufacturing sector, which is 27.4 percent of all manufacturing jobs in the State. Over the period 1995-2000 however, the manufacturing sector in the City shed 32,000 jobs; 42.1 percent of this loss was in Manhattan. The largest decline in jobs was in the City's apparel industry, which lost 16,000 jobs in this period. The second half of the 1990s was a period of rapid growth in New York City. This growth was fueled by the strong growth of the service sector and FIRE. Between 1995 and 2000, New York City added 47.7 percent of new jobs and 63.6 percent of wage growth in the State. Of these new City jobs, 74.1 percent were in the service sector (see Figure 30). The largest gain in jobs was in Manhattan, which added 78.1 percent of all new service sector jobs in the region. The business services industry in the City gained 41.7 percent of all new service sector jobs in the City.
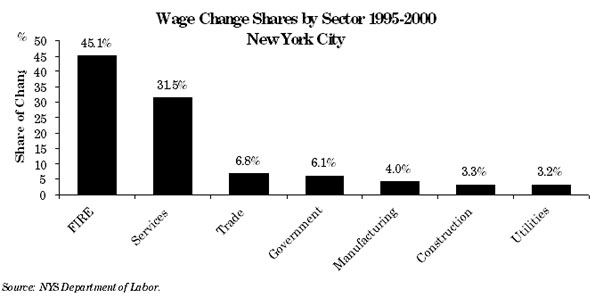
Wage growth was led by the FIRE and service sectors, which accounted for 45.1 percent and 31.5 percent of the total wage change in New York City between 1995 and 2000 (see Figure 31).
The performance of the FIRE sector in New York City was also impressive. FIRE gained 15,320 jobs in the 1995-2000 period. This sector has made a significant contribution to the economic revival of the City since the 1990-91 recession and to the general fiscal health of the City.43 In the period 1995-2000, this sector added $32.7 billion in wages. |
|
42 Office of the Comptroller, the City of New York, Economic Notes, August 2001. 43 "The New York Securities Industry: Its Economic Impact on New York State and City," Securities Industry Association, June 2001. |
|
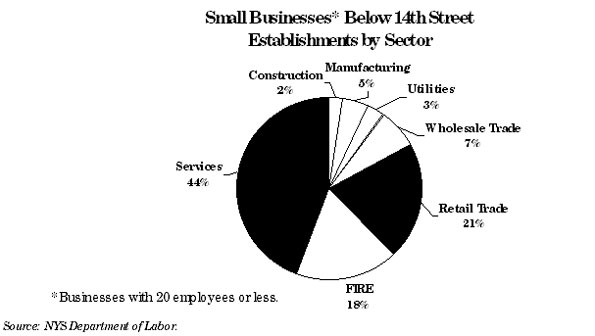
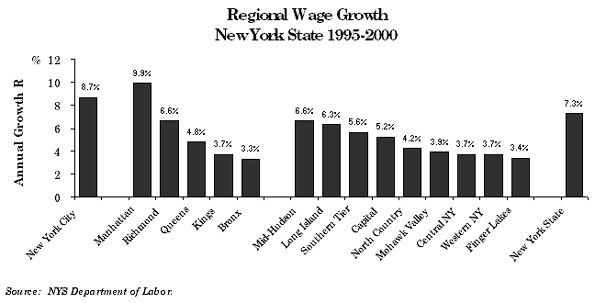
Economic Activity in New York City Counties The greatest concentration of economic activity in the New York City region is in Manhattan (New York County). The County accounted for 66.0 percent of the City's employment in 2000 and 81.1 percent of its wages. In the service sector, Manhattan accounted for 24.9 percent of the State's employment, and 35.8 percent of the State's wages. In the FIRE sector, the County accounted for 54.2 percent of the State's employment, and 80.3 percent of the State's wages in 2000. The State's securities industry is located almost entirely in Manhattan. New York County also accounts for 37.6 percent of employment in the State's insurance industry, and pays 54.0 percent of the State's wages in this industry. Employment grew 2.2 percent per year between 1995 and 2000 and wages grew 9.9 percent per year. The State's activity in the air transport industry is concentrated in Queens County, which accounts for 51.7 percent of the State's employment in this industry and 57.5 percent of the State's wages. New York City's airports-JFK International and LaGuardia-are both located in Queens County. Transport industries employ about 74,000 workers in Queens. Industries that facilitate commuting to work and general travel-such as local and suburban transit and transportation services-are prominent in Queens County. The disruption to air travel and to the transportation industry in general is expected to affect Queens County significantly. Employment growth between 1995 and 2000 was 1.7 percent per year, and wages grew 4.8 percent per year in Queens County. The health service industry, which employs 15.8 percent of Brooklyn (Kings County) workers is its largest employer. Total employment grew 1.3 percent per year in the county during the 1995-2000 period, and total wages grew 3.7 percent per year. Employment growth was generally uniform across New York City counties in the 1992-2000 period, but in the 1995-2000 period, New York County and Richmond County generally grew at a faster pace than the other counties. The health service industry, which employs 28.0 percent of Bronx County workers, is also the largest Bronx County industry. Both employment and wage growth during the 1995-2000 period-0.9 percent and 3.3 percent respectively-were much lower than the City employment and wage growth rates of 2.0 and 8.7 percent. Staten Island (Richmond County) employed 88,307 people in 2000. The retail trade sector which employs 22.4 percent of the workforce in the County is the leading employer. Employment grew 2.7 percent per year, and wages grew 6.6 percent per year between 1995 and 2000. The Attack on New York City The above discussion of the New York City economy helps to place the disruption of the City economy due to the attack of September 11 in perspective. The attack was located in Lower Manhattan, and the immediate disruption to economic activity was to businesses located below 14th Street. Most of the activity in this area of Manhattan is in the FIRE and service sectors (see Table 8). These two sectors accounted for 72.1 percent of employment and 87.8 percent of wages below 14th Street.44 While these sectors are the largest, it must be noted that the area between Canal and Houston Streets, has a large share of the manufacturing activity in Manhattan (23.4 percent).45 In this Manhattan area, 7,302 people were employed in apparel manufacturing and 5,912 people were engaged in publishing and printing in 2000. In comparison with the average wage of $93,753 in the whole of Manhattan below 14th Street, the area between Canal and Houston Streets had an average wage of $42,481 in 2000.46 |
|
Table 8 |
|
Manhattan Below 14th Street
Employment and Wages, 2000* |
|||||
| Manhattan Below 14th Street | Share of State | ||||
| Industry | Employment | Wages | Employment | Wages | |
|
Total
(in Billions) |
Average | (Percent) | (Percent) | ||
| FIRE | 169,769 | $30.8 | $181,598 | 23.1 | 38.7 |
| Finance | 133,555 | 28.0 | 209,935 | 31.9 | 44.3 |
| Securities Industry | 99,960 | 23.2 | 232,223 | 50.6 | 53.0 |
| Services | 192,467 | 10.5 | 54,464 | 6.7 | 9.7 |
| Business Services | 62,397 | 3.9 | 63,032 | 10.6 | 15.0 |
| Other Services | 130,070 | 6.5 | 50,354 | 5.7 | 8.0 |
| Other Industries | 139,720 | 5.7 | 41,137 | 2.0 | 1.8 |
| TOTAL | 501,956 | $47.1 | $93,753 | 7.3 | 14.9 |
|
*Note: All data are for the private sector. Source: NYS Department of Labor. |
|||||
|
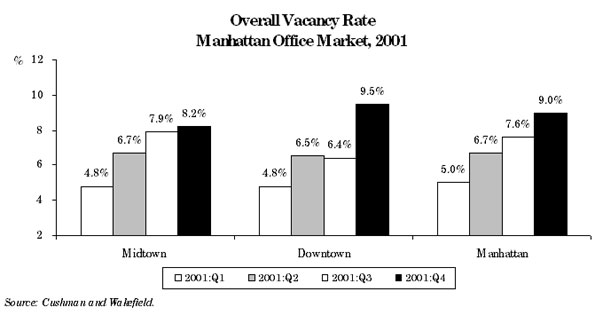
Trading activity resumed on Wall Street the week following the attack. The securities industry has reported a considerable decline in profit, however, and this decline is expected to affect variable compensation. In addition, some companies will substitute payments through stock options for cash bonuses. The insurance industry has a significant presence in Lower Manhattan. This industry will bear a considerable part of the losses due to the loss of life, damage to insured property, and the insured losses in business output. It is estimated, however, that most of the insurance companies are capitalized well enough to bear the expenses involved. Although the insurance industry is well positioned to weather the attack's impact, businesses in Manhattan will suffer increased insurance premiums as a result of the attack. For some businesses, these premium increases may be large enough to affect their financial viability. In fact, some businesses report that they are unable to get insurance at any price. Recent surveys have found insurance rates have risen 20 to 40 percent on average, with increases as high as 1,200 percent in some areas viewed as "high risk." This cycle of increased premiums is seen as lasting another 12 to 18 months, with customers likely fighting back against rate hikes and unfavorable contract terms in late 2002 or 2003. It is important to note, however, that trying to identify an "average" price increase was viewed by some risk managers as "meaningless" due to the wide range of experience among risk managers. The most frequent response for property renewals for Prudential Financial's survey was a 50 percent increase, with a low of 20 percent and a high of 330 percent. Casualty renewals ranged from 15 percent to 100 percent.47 The service sector will also bear a large part of the loss of activity and jobs from the economic effects of the attack of September 11. The loss of output due to the disruption caused by the attack in the service sector is a permanent loss, and it will be difficult to recover these losses by intensifying work effort. New York City has a significant share of the State's activity in the air transport, transportation services, and hotel industries. These industries will be affected by the slow-down in demand for air travel and reduced tourism in New York City. One particularly prominent component of business services in New York City is the advertising industry. This industry has declined significantly since the attack; however, it is important to note that the decline began before the attack. Office buildings and other property in Lower Manhattan suffered considerable damage. According to one estimate,48 12.5 million square feet of office space were destroyed and 7.7 million square feet of office space were damaged by the attack; this represents 5.2 percent of total Manhattan office space. To the industries affected by the attack, apart from the loss of human capital, this loss of space is the largest source of the disruption to economic activity. A large proportion of the activity located in the affected areas of Manhattan has moved to other locations in Manhattan itself, since the vacancy rates in Midtown, and Midtown South areas were high enough to accommodate the additional demand for space due to the attack. Vacancy rates in both mid-town and downtown Manhattan rose in the fourth quarter of 2001. This rise is on account of the combined effect of the national recession and the job losses related to September 11 (see Figure 32). Rents continued to fall as they did for most of 2001.49 Estimates of the number of jobs lost from New York City due to relocation out-of-state range from 18,500 to 31,800.50 It is currently uncertain how many of these jobs will be lost to the State permanently and how many will return following reconstruction. Early estimates of relocation indicated that more than half of the financial sector jobs that relocated out of New York City would return within a year.51 More recent information from some large financial sector firms suggests that at least 11,400 jobs (60.0 percent) will return to New York City during 2002.52 Preliminary work on New Jersey employment data also suggests a significant relocation of jobs to New Jersey in October 2001 and a return of jobs to New York City in November 2001.53 |
|
The value of physical capital stock damaged in New York City by the attack is estimated at $19.4 billion.54 This represents 1.7 percent of the total physical capital stock of the City economy. The availability of vacant space in other parts of Manhattan greatly softened the impact of this loss of capital stock on output. While this forecast assumes that Manhattan will bounce back from this shock and remain the financial capital of the world, there is a risk that the shock has caused, or accelerated, a permanent shift in the pattern of economic activity in the City. The long-term prospects for the City will depend crucially on the response to this disturbance in the near future. If Manhattan does bounce back as expected in this forecast, it will need to address serious infrastructure problems with transportation networks and utilities. |
|
44 NYS Assembly Ways and Means Committee, Economic News, October 1, 2001. 45 Although Manhattan is not known as a manufacturing center, it makes up 16.0 percent of State employment and 24.2 percent of State wages in this sector. In the new North American Industrial Classification System (NAICS), printing and publishing are classified under the new information section. In the new system, New York City's manufacturing job count will be much lower. 46 NYS Assembly Ways and Means Committee staff estimate. 47 "Insurance Rates Rising, Cycle Likely to Last to '03," Rebuilding Wall Street, February 6, 2002.
48 Cushman & Wakefield, October 2001
49 Cushman & Wakefield, January 2002
50 Estimates include 18,500 from "Rebuilding Wall
Street," Dow Jones Newsletter, November 7, 2001; 22,000 from tenantwise.com
51 New York City Partnership and Chamber of Commerce, "Economic Impact Analysis of the September 11 Attack on New York," November 15, 2001. The report estimated that 19,000 financial sector jobs would relocate outside New York City. 52 "Working Together to Accelerate New York's Recovery," February 11, 2002-update of the New York City Partnership's "Economic Impact Analysis of the September 11 Attack on New York," November 15, 2001. 53 "New Jersey's Economic Forecast-2002 and Beyond," James W. Hughes and Joselph J. Seneca, New Jersey Municipalities, February 2002. New Jersey gained 15,400 jobs in October, after seven months of negative employment growth. In November, however, the State lost 5,400 jobs, of which 2,400 were financial sector jobs. 54 "Working Together to Accelerate New York's Recovery," February 11, 2002-update of the New York City Partnership's "Economic Impact Analysis of the September 11 Attack on New York," November 15, 2001, and personal communication with New York City Partnership. |
|
Effect of the Attack on Local Small Businesses The vast majority of establishments affected by the September 11 attack were small businesses. In the area of Manhattan below 14th Street, 97.0 percent of establishments employed 100 people or less, and 85.7 percent of establishments employed 20 people or less. Although large businesses employed more people in the area, businesses with 100 people or less did make up a very significant 41.6 percent of employment, or about 210,000 workers. In the State, 46.6 percent of the employment and 38.2 percent of wages originate in small businesses. It is estimated that 14,632 businesses were destroyed, damaged, or significantly disrupted by the attack.55 Small businesses in the area below 14th Street differed somewhat from larger businesses in their sectoral composition. Small businesses tended to more often be services and retail establishments, and were less likely to be in the FIRE sector (see Figure 33). |
|
Although the attack affected both large and small businesses, smaller establishments are less likely to have the capital and access to financial markets needed to weather a severe shock. Therefore, it is likely that small establishments will disproportionately be driven out of business by the disruption following the attack. Fortunately, programs have been created to help assist small businesses affected by the attack. |
|
55 NYS Small Business Development Center, October 2001. |
|
Wall Street and the Securities Industry The Stock Market Stock market indices ended the year 2001 down. The Dow Jones Industrial Average finished the year down 4.9 percent. The S&P 500 was down 16.5 percent. NASDAQ sank 46.2 percent.56 Stock prices usually move upward following a rate cut and downward after a rate hike. However, despite 475 basis points of cuts in the federal funds rate in 2001, the stock market ended the year lower. So why didn't the rule hold this time? Because the easing monetary policy was not able to correct real imbalances (overcapacity and inventory correction), which need to run their course. The economy is still sluggish after eleven interest rate cuts. The expectation of a weak economic recovery, less impressive corporate profits, and the uncertainty created by the terrorist acts have put a lid on the stock market, even with all these interest rate cuts (see Figure 34).
|
|
56 These declines are based on 2001 average price compared to 2000 average price. Using point estimates rather than averages for the period from January 2 to December 31, 2001, the Dow Jones Industrials finished the year down 7.1 percent, S&P 500 down 13.4 percent, and the NASDAQ down 21.0 percent. |
|
Securities Industry Revenue and Profit Prior to September 11, the Securities Industry Association (SIA) projected that domestic pre-tax profit would decline to $15 billion in 2001 from $21 billion in 200057 (see Figure 35). The decline was expected to come from falling merger and acquisition fees, reduced stock sales and trading commissions, and lower individual investor trading.58 In the wake of the September 11 attack, SIA revised downward their expectations for the full year of 2001 to $10.2 billion in pre-tax profits,59 down 51 percent from 2000. SIA is projecting pre-tax profit to grow 8.4 percent to $11.6 billion for 2002.
The largest sources of revenue for the securities industry are commissions, followed by trading gains, and underwriting revenue. Together, these three sources make up a third of total revenue (see Figure 36). Mergers and acquisitions are included under other revenues.60
|
|
57 Research Reports, Securities Industry Association, June-July 2001, Vol. II, No. 6. 58 Part of this decline in investor trading was expected to be due to a change in trading practices known as decimalization. With decimalization, trading would no longer be conducted based on fractions such as one-eighth or one-quarter but instead would be based on the decimal system-which sharply narrows bid-offer spreads-limiting trading profits, especially for individual investor trading. 59 Research Reports, Securities Industry Association, January 31, 2002, Vol. III, No.1. 60 Other revenue includes investment gains, research revenue, private placement fees, proxy solicitation fees, service charges (such as for mergers and acquisitions), fees for options done away from an exchange, dividends and interest from investment accounts, subscription fees for periodical publications, and revenue not related to brokers' securities business. |
|
Mergers and Acquisitions In 2001, the United States recorded 7,533 Mergers and Acquisitions (M&A) deals valued at $825.7 billion, down 52.6 percent from year 2000. Factors contributing to the decline in M&A activity include the drop in stock prices, declining corporate earnings resulting in less corporate focus on expansion, changing in accounting rules, and difficulty in getting deals approved by regulatory authorities.61 There was also a shift in the type activity from tech, media, and telecom sectors to financial institutions, energy, consumer products, and health care sectors. The decline in mergers and acquisitions activities has spillover effects since lawyers, business services, and printing companies also depend on this business. |
|
61 Accounting rule changes that negatively affected Mergers and Acquisition activity included disallowing the pooling method for mergers and adopting new Federal Accounting Standards Board rules that forced merged corporations to amortize goodwill, creating a drag on earnings. In addition, there was difficulty in getting deals approved by the U.S. regulatory authorities and/or the European Commission. |
|
Long-term Relocation of Securities Industry and the Impact of September 11 There has been a long-term decentralization trend in the securities industry. As shown in Figure 37, this has resulted in New York, the traditional center for this industry, holding a declining share of industry employment. However, the decentralization has primarily been in back-office operations, with the highest paid workers remaining in New York. As indicated, the wage share of this industry has barely declined despite the drop in employment share. It should also be noted that this industry had been growing, therefore total employment in New York has been rising, despite the declining share.62
The September 11 attack and the resulting relocation of securities industry workers may have accelerated the decentralization trend. Therefore, the decline in New York Securities Industry employment from the attack may not result in a comparable decline in wages in the long-run. The attack has also put a premium on having parallel operating capacity in the industry. Some of this premium may actually be an overreaction that will decline over time. |
|
62 Accounting rule changes that negatively affected Mergers and Acquisition activity included disallowing the pooling method for mergers and adopting new Federal Accounting Standards Board rules that forced merged corporations to amortize goodwill, creating a drag on earnings. In addition, there was difficulty in getting deals approved by the U.S. regulatory authorities and/or the European Commission. |
|
Underwriting Activity During 2001, interest rates were lower and stock market prices were generally declining as well. Therefore, corporate bond issuance set a record, while equity underwriting declined. In 2001, overall U.S. corporate underwriting activity (corporate debt and equity) totaled $2,535.1 billion, up 37.0 percent over a year ago. Corporate debt underwriting increased 43.7 percent to $2,365.4 billion while equity underwriting declined 17.0 percent to $169.7 billion for the first ten months of 2001 (see Figure 38). Municipal bond underwriting increased 46.1 percent to $283.5 billion during the same period.
|
|
Stocks vs. Housing in Driving Consumer Spending Household ownership of stocks has exploded over the past decade, increasing from 27 percent of assets in 1991 to 49 percent in 2000. Meanwhile, the proportion of families owning their own homes increased from about 64 percent to 67 percent over the same period. Nevertheless, household wealth still remains fairly concentrated (see Figure 39).
As of 1998, the portion of aggregate household wealth held in all financial assets was more than that held in real estate wealth63 (see Figure 40). This is due to an increase in stock value, mutual funds, retirement accounts, and other managed financial assets. However, this may overstate the importance of stock market and other financial asset gains in driving consumer spending for two reasons. First, stock market and other financial asset wealth is much more concentrated than real estate wealth. As total wealth increases, a greater percentage is held in financial assets (see Figure 41). Second, consumers spend from 3 to 5 percent of an overall increase in net worth, but spend 10 to 15 percent of the realized capital gains from the sales of homes.64 This implies that household consumption behavior is more sensitive to changes in housing net wealth than to changes in net stock wealth. |
|
|
|
In fact, home mortgage rates fell sharply in late 2001 and reached a low of 6.45 percent the week of November 8, 2001,65 the lowest level in years. Americans are taking advantage of the opportunity by refinancing their mortgages in record numbers. Between September 11 and November 1, 2001, about one million people applied to refinance their home loans, roughly six times as many as did during the comparable period in 2000. The surge in refinancing, which effectively gives extra cash to families by lowering their monthly mortgage payments, is providing important support to an economy that is struggling. The typical family that has refinanced in October 2001 has lowered its monthly payments by $150 to $200, according to the Mortgage Bankers Association of America.66 In addition to reduced mortgages, some consumers also cash out equity when they refinance, in effect unlocking wealth they have accumulated. About three-fifths of consumers refinancing in the second and third quarters of 2001 have cashed out equity.67 The median refinanced mortgage was about four years old over the last five years, though this age has declined recently. The amount of equity available to cash out will in part be determined by the appreciation over that same period of time in housing prices. As Figure 42 indicates, housing appreciation has increased recently. Housing prices have increased about 30 percent over the last four years. The housing market has also remained strong in recent months despite the recession. Housing prices were up 8 percent in the third quarter of 2001 over the same period in 2000. Both new and existing home sales rose to record high levels in 2001. This, combined with low interest rates, encouraging refinancing, may have led to substantial cashing out of equity helping to mitigate the drop in consumption from the current recession. According to Fannie Mae, 2001 set a record for refinancing activity including $80 billion in cashed-out equity.68 |
|
|
|
Average 30-year mortgage rates fell to a low of 6.62 percent for the month of October 2001 from a high of 8.3 percent in February 2000. The 6.62 percent rate in October was the lowest rate recorded in thirty years. The Treasury Department's announcement on October 31, 2001, that it would stop selling 30-year bonds should create additional demand for long-term bonds and send the interest rates on these issues lower, pushing down the long-term rates on home loans, if only slightly.69 This could help in extending the refinancing activity and work toward mitigating what would be an even further reduction in consumption spending. |
|
63 Financial assets include stocks, bonds, mutual funds, CD's, savings bonds, transaction accounts, retirement accounts, cash value of life insurance, and other managed assets. 64 Federal Reserve Board Chairman's opening remarks at the symposium sponsored by the Federal Reserve Bank of Kansas on August 31, 2001. Other sources also find that household wealth gains are spent more readily than wealth from other sources. For example, a recent paper by the National Bureau of Economic Research found a more powerful wealth effect for housing than stocks, see "Comparing Wealth Effects: The Stock Market vs. The Housing Market," Karl Case, John Quigley, and Robert Shiller, National Bureau of Economic Research, November 2001, Working Paper #8606. 65 Freddie Mac 30 year average weekly rate. 66 "Low Mortgage Rates Spur Big Surge in Refinancing," David Leonhardt, The New York Times, November 2, 2001. 67 Data is from Freddie Mac, with the percentage of people who have increased their loan when refinancing by at least 5 percent used as a proxy for those who have cashed out equity. 68 "Berson's Housing and Economic Report: January Economic and Mortgage Market Development," Fannie Mae, January 2002. 69 The Treasury Department's decision to stop selling 30-year bonds could help push longer-term rates lower for reasons that have less to do with the economy than with the mechanics of the bond market. With no new 30-year bonds, more investors who want to own long-term bonds backed by the government will buy the Treasury's 10-year note, which influences the interest rates on home mortgages. The added demand will push the price of the 10-year bond higher and the yield, which moves in the opposite direction, lower. With the 10-year rate and related rates falling, mortgage rates will fall, too. See, "Low Mortgage Rates Spur Big Surge in Refinancing," David Leonhardt, The New York Times, November 2, 2001. |
|
Monetary Policy In early 1999, a high expected return on high-tech investments and Y2K investments led to a surge in business capital spending. These higher expected returns lifted equity prices, which in turn contributed to an increase in household wealth and thus household spending. Household spending growth outpaced growth in personal income, which in turn created a pressure on growth of savings. Household spending growth relied increasingly on savings from abroad. Investment opportunities in the United States induced substantial inflows of funds from abroad. With less savings to finance capital spending, average real-term corporate interest rates started to rise, and required a major infusion of liquidity into an economy already threatening to overheat. By June 1999, the Federal Open Market Committee adopted tightening monetary policy to slow the economy from overheating, increasing the federal funds rate by 175 basis points (see Figure 43). By May 2000, growth of liquidity (measured by money supply M2) barely slowed.
By summer 2000, overall capacity in high-tech manufacturing industries rose very rapidly by a rate of 50 percent annually. The diminishing pool of available workers was noticeable; unit labor and energy costs surged. Corporations started suffering from a profit margin squeeze. Excess production was inevitable at this point. Inventory started picking up, short-term rates of return fell, and manufacturers began to cut production to stem the accumulation of unwanted inventories. Corporations started scaling back on new capital spending. On January 3, 2001, with inflation under control, the Federal Open Market Committee adopted an aggressive easing monetary policy to confront a sharply slowing economy. The Federal Reserve lowered the federal funds rate eleven times in 2001, a total of 475 basis points. Part of this reduction was in response to economic weakness observed by the Fed after the September 11 attack. Within three months of the attack, the Fed cut rates four times for a total of a 175 basis point reduction. As a result, the federal funds rate is currently at its lowest level since 1961. There are limitations on what monetary policy can do. For example, while short-term rates declined from the Fed's actions, most long-term interest rates have not declined as rapidly. The Fed's actions widened the interest rate spread (see Figure 44) and steepened the yield curve. This was due in part to an expectation that the budget surplus would be revised down, leading to an expectation that the supply of treasury bonds in the future will be high. Another reason may have been the long-term expectation that inflation would rise from the easing monetary policy. In addition, the market may have expected any economic slowdown to be short-lived, leading to an expectation of higher short-term rates in the future, and therefore causing long-term rates to stay high relative to short-term rates. Another limitation on monetary policy is that banks may tighten lending, negating some of the Fed's actions. This would be especially likely to occur in a recessionary environment, choking off business spending and hurting chances for a quick recovery. Therefore, the Fed's power to stimulate the economy out of the current recession is limited by the willingness of banks to utilize the liquidity created by the Fed. In fact, there is some mixed evidence on whether this is happening now. According to the most recent Federal Reserve survey of lenders, credit standards are tightening for business and some household loans, but not for mortgage loans.70
The Fed is also limited in how low it can reduce interest rates. As the federal funds rate gets closer to zero, the Federal Reserve loses some of its power to influence economic activity. This situation has occurred in Japan, where the economy remains weak despite repeated interest rate cuts by the Central Bank. Since the current rate in Japan is very close to zero, there is little further the Central Bank can do there to boost economic activity. |
|
70 "U.S. Banks Tightened Their Lending Rules Over Latest 3 Months," Dow Jones Newswires, February 5, 2002. |
|
Fiscal Policy Fiscal policy represents government spending, tax policy, and transfer payments. The fiscal policy response to the September 11 attack will likely target both disaster assistance/retaliation plans and economic weakness. This stimulus includes $40 billion in an emergency-spending authorization (for defense, rescue, and rebuilding efforts), a $15 billion airline aid package71 already approved by Congress, and possibly an additional stimulus package. However, most of this stimulus did not affect the economy in 2001. As a percentage of GDP, this fiscal stimulus is not as large a boost in government spending as the country has seen during prior major wars (excluding the Gulf War). For example, during World War II defense spending reached 38 percent of GDP (see Figure 45). This would be the equivalent of spending about $3.5 trillion in defense today, or very roughly ten times current military spending. Spending for defense peaked at 14 percent of GDP during the Korean War and 9 percent during the Vietnam War. Currently, about 3 percent of GDP goes to defense and none of the fiscal measures proposed so far would bring this significantly above 4 percent.
This fiscal package would force the government to engage in deficit spending after several years of running surpluses and whittling down the federal debt. Over the past decade, the federal budget has experienced a dramatic shift. In 1989, the federal deficit amounted to 2.8 percent of GDP. By 1998, as a result of both deficit reduction efforts and strong economic growth, the federal government ran a budget surplus of 0.8 percent of GDP, which rose further to 0.9 percent in 1999 and 1.2 percent in 2000. Debt held by the public, as a percent of GDP fell 15 percent between 1995 and 2000. The nation enjoyed a relatively good long-term budget outlook. The $1.35 trillion tax cut enacted in spring 2001, which is to be distributed over the next 10 years and includes a $100 billion tax relief spread over 2000 and 2001, was purported to boost the economy or the markets in the short-term and the long-term. However, according to the report from the Commerce Department on October 1, 2001, consumers mostly saved their tax rebates or many low-income households in debt used the money to pay off credit-card balances instead, so that the tax rebate failed to stir new spending even though rebate checks were distributed in a more timely manner than many previous fiscal stimulus efforts. In addition, 29 million low- and moderate-income families paid payroll and excise taxes, but did not have enough income to owe federal income taxes and did not receive rebates. Economic theory supports the conclusion that families with lower incomes are more likely to spend, as opposed to save, any additional income than higher-income families.72 In addition, research indicates that consumer spending is more responsive to permanent tax cuts than a temporary change,73 therefore the 2001 tax rebate and any future one-time tax cuts may have limited impact. There will be some additional stimulus for 2002 originating from the spring of 2001 tax cut. The tax rate on the lowest bracket has been reduced by one-third. This tax change effects high-income households as well as low-income households. In addition, reductions in the top marginal tax rates are being phased-in over several years. Since this change was made to income withholdings, the change should already be affecting consumer spending. The Congressional Budget Office estimated in January 2002 that the surplus projected a year ago for 2002 and 2003 has now changed to a deficit (see Figure 46). That figure does not include any new spending to stimulate the economy and pay for further defense and security needs that may be passed after January 2002. The ten-year budget outlook has changed significantly because of the tax cut.74
There is controversy over the proper way to stimulate the economy and whether a stimulus is still needed. Fiscal stimulation can be done in a number of ways, such as increasing government spending or lowering tax receipts. However, prudent fiscal policy varies in a countercyclical way, with deficits in bad times to increase demand and stimulate economic activity, and surpluses in good times to moderate inflation. By the time any further stimulus is enacted it will likely be after the recession has ended. |
|
71 The airline package actually consists of $5 billion in grants and $10 billion in loan guarantees. It appears that most of the loan guarantees will not be utilized. Therefore, the actual package may be closer to $5 billion. 72 This was originally theorized by Keynes and then later developed by other economists. In more recent formulations wealth must be held constant for this to be true. For example, see discussion in Macroeconomics, N. Gregory Mankiw (Worth Publishers 2000) pp. 434-55. 73 "The Effect of Tax Changes on Consumer Spending," Charles Steindel, Current Issues in Economics and Finance, December 2001. 74 While the most significant factor in changing the projections for 2002 and 2003 from a surplus to a deficit is the changing economic outlook, the biggest factor in changing the ten-year budget outlook has been the tax cut. |
|
Global Economic Slowdown and the United States Economy Even before the September 11 terrorist attack economic activity was continuing to worsen not only in the U.S. economy but also in the rest of the world. The euro zone's75 annual rate of growth declined to 0.9 percent in the third quarter of 2001 from 2.4 percent in the last quarter of 2000. |
|
75 The countries of the euro zone are Austria, Belgium, Finland, France, Germany, Greece, Italy, Ireland, Luxembourg, the Netherlands, Portugal, and Spain. Denmark, Sweden and the United Kingdom are not part of the euro zone. |
|
Germany Nowhere in the region was the slowdown more pronounced than in Germany, which accounts for about one-third of the region's GDP. Germany's annual rate of GDP growth slowed from 4.6 percent in the second quarter of 2000 to below one percent thereafter, the weakest growth since the third quarter of 1999. Unemployment rose to 9.5 percent in December, the highest since August 2000. Industrial production has seen a decline of 1 to 4 percent over a year ago every month since June 2001. New orders in manufacturing have also contracted 1 to 9 percent a month since March 2001. In addition, business confidence fell to 84.9 in November 2001, the lowest level since October 1993. Consumer confidence declined to its lowest level in December 2001, the lowest since December 1997. On the price front, annual CPI inflation surged to an eight-year high of 3.5 percent in May, but it has since declined to 1.7 percent in December 2001. But it is still well above the European Central Bank's targeted ceiling of 2.0 percent for 2001. Higher inflation in the first half of 2001 has resulted primarily from the livestock crisis, poor weather, high energy prices, and a weak euro. Japan The situation in Japan, the second largest national economy in the world, is far worse. Industrial production has contracted for 11 months in a row since the last month of 2000. Consumer sentiment fell to 36.9 percent in the third quarter of 2001, the lowest since the third quarter of 1998. The unemployment rate rose to a record high of 5.5 percent in November 2001. Manufacturing sector activity was hit hard by deterioration in the broader global economy. In November, exports were down 9.0 percent year-over-year, a dramatic turn-around from the 8.4 percent increase recorded in the last month of 2000. Overall, the Japanese economy went into another recession in the second half of 2001 (see Figure 47). The reasons for recent recessions are well-known and widespread. Domestic banks, undercapitalized and saddled with bad loans, are reluctant to lend. Meanwhile, companies, expecting little or no growth in the future, are hesitant to borrow. Also, deflation continues to be a problem, raising the real cost of debt while encouraging consumers to postpone spending. The Bank of Japan is resisting an aggressive monetary expansion until it sees signs of financial restructuring.
Apart from China, where GDP growth recorded 7.3 percent in 2001, most of the Asian economies significantly weakened throughout 2001. The economic slowdown in this region was due, in part, to their strong ties to the United States economy through trade. United States The recent slowdown in the global economy has contributed to a decline in demand for U.S. exports. U.S. exports of goods and services, which grew at an annual rate of roughly 10 percent up until the third quarter of 2000, have declined sharply thereafter, reaching a 12.2 percent decline in the fourth quarter of 2001. The recent decline in exports, though, came mainly from a decrease in merchandise exports (down 17.3 percent in the second quarter of 2001), as service exports still showed growth, although at a significantly lower rate (2.4 percent). Starting from the third quarter of 2001, however, service exports growth also turned negative. Since merchandise exports account for 71.5 percent of U.S. total exports or 8.2 percent of GDP,76 the U.S. manufacturing sector has weakened accordingly. Like exports, U.S. imports grew rapidly until the third quarter of 2000. The annual rate of growth was more than 10 percent. U.S. imports have since declined, but less rapidly than exports have, except for the first quarter of 2001. As a result, the trade deficit has still been increasing in recent quarters. It was $418.6 billion in the fourth quarter of 2001, $7.6 billion higher than in the previous quarter. |
|
76 These shares are the averages for the period beginning in the first quarter of 1995 and ending in the first quarter of 2001. |
|
|
|
Value of the United States Dollar
Although the U.S. dollar briefly fell against the euro and the yen in the wake of the September 11 terrorist attacks, it regained most of its strength by the third week of October. Between September 2001 and the second week of February 2002, the U.S. dollar appreciated 12.6 percent against the Japanese yen, and 4.7 percent against the euro (see Figure 48). In terms of the trade-weighted value, it was 7.8 percent higher in January 2002 than a year earlier. Furthermore, it still remains robust against the currencies of some emerging-market countries. This has caused strong pressure from exporters in the United States and finance officials abroad for a weaker dollar. A strong dollar has contributed to the weak performance of the U.S. export sector, particularly the exports of goods-and as a result, the manufacturing sector. From a long-run perspective, the trade-weighted value of the U.S. dollar has been rising since the middle of the 1990s. As a result, U.S. products have been less competitive in world markets. Since 1995, the U.S. current account deficit has more than tripled to $426 billion (or 4.6 percent of GDP).
In the past, large current account deficits have led to a currency plunge. Recent episodes include the so-called twin deficit crisis in the U.S. in the mid-1980s, the 1995 peso crisis, and the 1997 Asian crisis. Would a sharp depreciation of the U.S. dollar be a major concern? Some leading economists have said it would probably not, since the U.S. economy has slid sharply, and "the strong dollar is one of the reasons the Federal Reserve is having trouble pulling us back from the brink."77 In other words, the argument here is that the U.S. should recover first, and that the recovery in the rest of the world will follow.78 It is based on the assumption that as the U.S. economy led the world on the downside, it is capable of leading the world back on the upside-with the rest of the world responding simply with a lag. But a sharp depreciation of the U.S. dollar might create problems elsewhere. This is especially true in the already weakened emerging market economies as well as in Japan, where the share of their GDP accounted for by exports is significantly large and therefore so is their dependence on the U.S. economy for recovery. A U-shaped recovery in the U.S. economy may not be enough to jump-start these economies. What these economies will eventually need to rely on is not as much a recovery in the U.S. economy as the cultivation of their own internal demand by increasing economic efficiencies. This is particularly true now, given that the 40 percent contribution the U.S. economy made to the cumulative growth in world GDP over the five years ending in mid-2000 is in the process of going to zero as the U.S. has gone into recession.79 |
|
77 "Blessed Are the Weak," Paul Krugman, The New York Times, August 1, 2001. 78 "A Weak Dollar Could Help the U.S. (and Europe)," Jonathan Fuerbringer, The New York Times, July 29, 2001. 79 "Global Paradox," Stephen Roach, Blue Chip Financial Forecasts, August 1, 2001. |
|
|
|
Energy
Electricity Recent events have raised concerns over the electrical industry. Efforts at deregulating power markets, volatile fuel prices, and the collapse of Enron with the subsequent impact on credit markets for energy companies have heightened worries that generating capacity may not be available when it is needed. The state of California typified what can go wrong in electricity markets as rolling blackouts cascaded across the State in the spring of 2001. The resolution of California's problems included the State signing long-term power contracts at rates that are much above current levels and the bankruptcy of California's largest power company. Adding to the State's woes may have been the manipulation of power prices by a number of companies that led to charges as much as $9 billion higher than would have been warranted in truly competitive markets.80 Fortunately, the combination of factors that led to problems in California was unique to California and has not been duplicated in New York or elsewhere. While New York still suffers from electric costs substantially higher than the national average, fears that parts of the State were likely to suffer from blackouts in the near term have been allayed. In New York State the most likely time for a problem is the summer when air conditioning use peaks. At the beginning of June 2001 the New York Independent System Operator (NYISO) predicted that New York City would escape the summer without blackouts. However, the margin would be quite thin (about 2.0 percent), so extreme weather conditions could push the City over the edge. As it turned out, New York completed the summer of 2001 without any power shortages. Energy demand peaked during a four-day heat-wave in August. Energy use for the State reached 30,983 megawatts, beating the 1999 record of 30,311 megawatts. New York City also set a new record with 12,207 megawatts of power used. Some regions of the State were closer to capacity than others. Long Island in particular had demand levels that were very close to exceeding capacity. In 2002, New York appears to have sufficient power to meet demand. The disruption from the attack actually reduced electricity demand in the short term for New York City by 90 megawatts. This, combined with the current recession, should help insure that State electricity demand is in line with supply for now. For the longer-term, New York could face shortages unless new capacity is added. Demand in New York City has been increasing at 1.5 percent a year. NYISO predicts State peak demand will increase 1.2 percent to 1.4 percent each summer through 2005. NYISO also forecasts a 7.0 percent increase in wholesale electricity prices between 2001 and 2002 and a five-year increase of 46.0 percent unless new power plants are built. In recent months, most of the nation has moved from a situation with tight electricity supply to a surplus. Many experts are now predicting that low demand in the summer of 2002 will bring prices down enough to make some plants under construction unprofitable; especially since many industry participants are having trouble in the credit markets since the Enron collapse. In particular, the tightness of supply and demand would raise prices in parts of New York. The North American Electric Reliability Council indicates that New York is a potential problem area (in fact, outside of the western states, New York is the only other area cited as having a potential reliability issue). According to the Council, there is a serious threat of demand outstripping supply in the future.81 New York will need to be careful to make sure power generation capability keeps up with demand. As many as three-quarters of the sixteen power plants planned for New York could be deterred or cancelled. Electricity in New York will also be impacted by the merging of its power market with the rest of the Northeast. The Federal Energy Regulatory Commission is pushing the Independent System Operators for New York and New England to form a single regional transmission organization. This will present significant technical obstacles. However, it may ultimately lead to increased market efficiency since there are substantial price differentials at a given time in energy prices in the regions. The efficiency gains could save the combined region $440 million a year, reducing energy prices throughout.82 |
|
80 One study found that prices were higher than market-clearing prices and that many producers could have produced more energy than they did and still maintain a marginal cost below prices. The study also demonstrates that it is profitable for suppliers to withhold power at high-demand periods at times. See "A Quantitative Analysis of Pricing Behavior in California's Wholesale Electricity Market During Summer 2000," Paul Joskow and Edward Kahn, National Bureau of Economic Research, March 2001, Working Paper 8157. "California's Electricity Crisis," Paul Joskow, National Bureau of Economic Research, August 2001, Working Paper 8442 cites further evidence that wholesale prices were approximately one-third higher due to market manipulation. 81 "Reliability Assessment 2001-2010: The Reliability of Bulk Electric Systems in North America," North American Electric Reliability Council, October 2001, p. 46. 82 It should be noted that this estimate of savings is based on an earlier version of the merger that included Pennsylvania and was detailed in "Northeast Power Markets: The Argument for a Unified Grid," Public Utilities Fortnightly, Mirant Corporation, September 1, 2001, pp. 28-34. |
|
Oil and Natural Gas In terms of other energy costs outside of electricity, the two most significant issues are oil and natural gas prices. For oil prices, much will depend on the actions taken by the Organization of Petroleum Exporting Countries (OPEC) nations. After having set a price of between $28 and $30 a barrel as a target in mid-2001, OPEC saw prices decline and stabilize between $18 and $20 a barrel in late January and early February 2002.83 The drop in oil prices in late 2001 had a significant impact on consumer spending, since for every $1 drop in the price of a barrel of oil, the spending power of American consumers increases by $5 billion.84 Hoping to prevent the global economic slowdown from further eroding world oil prices, OPEC finalized an agreement on December 28, 2001, to cut production by 6.5 percent, or 1.5 million barrels a day, for at least six months starting January 1, 2002. The decision was made at an emergency meeting of OPEC ministers following a pledge by non-OPEC oil producers (principally Russia, Norway, and Mexico) to reduce their exports by 462,500 barrels a day. OPEC officials had prompted the non-OPEC nations to act using thinly veiled threats of a price war. However, only weeks after the biggest oil producing nations agreed to reduce output to avoid a global price war, Russia may be increasing its oil exports: this move could put it on a collision course with OPEC.85 The other issue is, of course, whether the current war on terrorism impacts oil prices. It currently appears that the countries that are important oil suppliers will probably not be drawn into the conflict, yet there is still a risk of oil prices being negatively affected by turbulence in the Middle East. It should be noted that the U.S. economy is less dependent on oil than it once was (see Figure 49). The economy is more service-oriented and requires fewer BTUs of energy to produce a given dollar of GDP.
There is some risk of temporary disruption to oil and gasoline supplies in particular due to consolidation in the gas refining industry. Although consolidation may increase efficiency, it also can reduce total reserves and make supplies more dependent on the decisions and fate of a small number of companies. |
|
83 Primarily due to a weaker world economy and resultant drop in demand for oil. 84 The drop in oil prices from $30 a barrel in 2000 to $20 a barrel in 2001 resulted in roughly a $50 billion increase in consumer spending power. This is of the same magnitude as the spring of 2001 tax cut. See "Falling Oil Prices Set to Bolster American Economy," David Barboza, The New York Times, November 16, 2001; and "OPEC Warns of $10-a-Barrel Price for Oil," Brustan Bahree and Thaddeus Herrick, The Wall Street Journal, November 16, 2001. 85 "Russia Appears to Throw Curve at OPEC," The Wall Street Journal, February 11, 2002, p. A3. |
|
|
|
Uneven Population Growth
The 2000 Census puts the population of New York State at a record high of 18,976,457. Almost one million residents were added to the State's population between 1990 and 2000. This 5.5 percent increase is, however, significantly smaller than the United States' 13.1 percent increase for the same period. From 1990 to 2000, the distribution of New York's population shifted further to the downstate area, i.e., New York City,86 Long Island, and the Mid-Hudson region, after 1990. By 2000, approximately 13 million New Yorkers were concentrated in the downstate area, accounting for over 71 percent of the State's population.
|
|
86 It should be noted that the change in New York City population may partially be a statistical artifact caused by an intensified effort to identify previously uncounted residents in this particular area. |
|
|
|
Income Inequality
When observed purely at an aggregate level, it appears that the standard of living has generally increased in the United States and in New York State over the past two decades. However, this aggregate picture quickly changes when the distribution of income is taken into consideration. The wealthiest households have received by far the greatest gains in both income and wealth while the poorest households have had virtually no increase or even declined in income and wealth using many measures. In fact, some studies actually show not only that the gap between the rich and the poor widened, but that the poorest Americans got even poorer in absolute terms after adjusting for inflation. For example, a study by the Congressional Budget Office87 indicated that while the average pre-tax income of the richest 20 percent of households went up 53 percent (or by an average of $58,000) and the average pre-tax income of the richest 1 percent of households more than doubled (up by $596,700), the income for the poorest 20 percent of households actually declined by 3.4 percent (down by $400) (see Figure 51).
|
|
87 "Historical Effective Tax Rates, 1979-1997, Preliminary Edition," the Congressional Budget Office, May 2001. |
|
|
|
United States Regions
The employment growth of all United States regions slowed down significantly in the first half of 2001. Employment in the U.S. economy grew at a steady rate of about 2.5 percent between 1998 and 2000. However, between 2000 and 2001 employment growth slowed to 0.4 percent. In the Northeast, growth in employment fell from 2.2 percent in 2000 to 0.7 percent in 2001. The slowdown in manufacturing employment in 2001 was particularly severe, highlighting the nature of the current national economic slowdown. The recent national slowdown is essentially a "manufacturing recession." The Midwest and South each lost about 190,000 manufacturing jobs in 2001. In comparison, the Northeast lost 123,000 jobs in manufacturing. Figure 52 shows that aggregate job growth slowed down in all regions of the United States.
The events related to the destruction of the World Trade Center affected all regions of the United States. Apart from the direct effects of these events on New York and the Northeast, other areas were affected due to the slowdown induced by the disruption of transport and by corporate decisions on investment spending. In addition to the generalized economic effect of the events of September 11, the West is affected because of its reliance on airplane manufacturing and tourism, while the Midwest is affected by the concentration of the insurance industry.88 |
|
88 "Attack Injures All Regions," Economy.com, September 25, 2001 |
|
|
|
New York State Sectors Economic progress in New York in the 1990s had been driven by two important factors. First, the economic changes from the shift in employment from manufacturing to the service sectors have continued, and strong changes in employment across industries have occurred. In the manufacturing sector as a whole, employment has fallen while wages and output has risen, indicating productivity increase and technological change in this sector. Within manufacturing, there are new growth industries: electronics is one such industry for New York. The second important economic event is the strong performance of the financial markets. This has produced large wealth increases as well as large employment and wage gains for the State. Recent employment growth in New York has greatly reinforced the change in the composition of employment towards the service sector. The service sector employs 34.8 percent of the State's workforce and pays 29.1 percent of the wages (see Table 9 and Table 10). During the period 1995-2000,89 the service sector accounted for two-thirds (66.1 percent) of all additional jobs created in the State (see Figure 53). Business services is the leading industry in this sector, accounting for 38.4 percent of all service sector jobs created. Education services and social services were two other significant sources of new jobs (i.e., social, engineering, health, educational).
Across the State, and more so in metropolitan areas, the composition of activity has shifted towards skill-intensive and high-technology activity. This is true of both the manufacturing and service sectors. Further, the overall pace of change appears to have accelerated, and businesses have responded with smaller permanent workforces and larger numbers of temporary workers.90 |
|
89 The 1995-2000 period was a period of rapid growth after the prolonged effects of the 1990?91 recession and the "soft landing" of 1995. This period also intensified some of the patterns of change in economic activity in the State. 90 "Industrial Restructuring in the New York Metropolitan Area," James Orr, Economic Policy Review, Federal Reserve Bank of New York, February 1997, Vol. 3, No. 1. |
|
|
|
New York State Regions
Figure 54 shows that New York wages have grown in recent years (1995-2000) at the annual rate of 7.3 percent. New York City led this growth, with a rate of wage growth of 8.7 percent per year. Wage growth in other areas of New York ranges from 3.4 to 6.6 percent per year.
In the 1990s economic expansion, the top ranks for employment growth were in the downstate regions of New York City, Long Island, and the Mid-Hudson. The exception to this was the 1992-95 period, when many upstate regions grew faster. In general, regions with larger shares of service sector employment grew faster (see Table 11 and Table 12). While New York State employment between 1995 and 2000 has grown at an annualized rate of 1.8 percent, the rest of the nation had employment growth that was 35 percent faster (2.4 percent). Had New York State kept pace with the nation91 over this period, it would have added 260,000 additional jobs. Extending the growth period to cover the start of 1995 to 2001, the New York State economy would have added 364,000 additional jobs had it kept pace with the nation. Even in 2001, New York has grown more sluggishly than the other very large states. Florida, California, and Texas were all among the top five states in terms of growth rate. In addition, the employment growth rankings show evidence of a lagging upstate economy. Upstate New York ranked among the twenty slowest growing states. Between 1992 and 2000, New York State gained $137.1 billion in wages. Of these, 62.0 percent were created in New York City. In the State, wages grew by 5.7 percent per year between 1992 and 2000. The rate of wage growth ranged from 3.2 percent in Central New York to 6.6 percent in New York City. For the entire 1992-2000 period, wages grew fastest in New York City, Long Island, and the Mid-Hudson. New York City accounted for 55.5 percent of the wages in the State. Long Island earned 11.9 percent of the wages in the State, and the Mid-Hudson earned 8.7 percent of the State's wages. The Western New York region earned 5.1 percent of the State's wages, and is the largest region in upstate New York. Using a longer time period, downstate's share of the economy has also increased relative to upstate. New York City's share of New York State wages increased 3.6 percentage points between 1992 and 2001. Long Island and the Mid-Hudson ranked second and third in the State in wage growth in the 1992-2000 period. The shares of these regions in State wages fell between 1992 and 2000 however, on account of strong wage growth in New York City-though it should be noted that the strong growth in New York City was mostly restricted to Manhattan and Richmond County. |
|
91 NYS Assembly Ways and Means Committee, Statistical and Narrative Summary of the Executive Budget, January 2002. |
|
Table 9 |
| EMPLOYMENT SHARE BY REGION | |||||||
| Services | Trade | Government | Manufacturing | FIRE | Utilities | Construction | |
|
|
|||||||
| STATEWIDE | 34.8 | 20.5 | 16.3 | 10.2 | 8.8 | 5.1 | 3.9 |
|
|
|||||||
| DOWNSTATE | 36.9 | 19.4 | 15.4 | 7.7 | 10.8 | 5.4 | 4.0 |
|
|
|||||||
| New York City | 38.9 | 16.7 | 15.1 | 6.5 | 13.4 | 5.7 | 3.3 |
| New York | 38.1 | 14.3 | 18.9 | 5.7 | 17.5 | 3.8 | 1.5 |
| Queens | 33.3 | 21.1 | 6.3 | 9.2 | 5.0 | 15.5 | 9.0 |
| Kings | 44.1 | 21.6 | 7.4 | 9.1 | 6.0 | 5.7 | 5.4 |
| Bronx | 47.7 | 20.3 | 11.0 | 5.1 | 5.8 | 4.5 | 5.2 |
| Richmond | 44.9 | 24.3 | 7.3 | 2.1 | 4.8 | 8.4 | 7.7 |
| Long Island | 33.1 | 25.5 | 14.9 | 9.4 | 6.8 | 4.8 | 5.1 |
| Nassau | 35.0 | 26.5 | 13.4 | 6.6 | 8.9 | 4.8 | 4.4 |
| Suffolk | 31.1 | 24.5 | 16.5 | 12.3 | 4.6 | 4.8 | 5.9 |
| Mid-Hudson | 33.9 | 22.3 | 17.5 | 10.4 | 5.3 | 5.0 | 5.2 |
| Westchester | 37.1 | 21.2 | 14.8 | 9.1 | 6.4 | 5.1 | 6.0 |
| Orange | 27.2 | 27.9 | 21.0 | 9.7 | 4.2 | 5.5 | 4.2 |
| Dutchess | 31.5 | 19.7 | 19.5 | 16.2 | 4.1 | 4.2 | 4.6 |
| Rockland | 32.3 | 23.1 | 17.9 | 11.3 | 4.7 | 5.7 | 4.5 |
| Ulster | 31.3 | 24.1 | 22.3 | 10.9 | 3.6 | 4.0 | 3.7 |
| Sullivan | 36.6 | 19.9 | 24.4 | 4.5 | 6.7 | 4.0 | 3.7 |
| Putnam | 35.2 | 20.0 | 17.9 | 8.7 | 5.1 | 2.7 | 9.7 |
|
|
|||||||
| UPSTATE | 29.9 | 22.3 | 19.0 | 16.2 | 4.6 | 4.3 | 3.7 |
|
|
|||||||
| Western New York | 29.4 | 23.2 | 16.9 | 17.0 | 5.1 | 4.7 | 3.5 |
| Erie | 31.2 | 23.6 | 15.9 | 14.7 | 6.2 | 4.6 | 3.7 |
| Niagara | 25.1 | 22.9 | 16.8 | 22.8 | 2.4 | 5.9 | 4.0 |
| Chautauqua | 26.3 | 22.2 | 17.6 | 24.9 | 2.2 | 3.9 | 2.8 |
| Cattaraugus | 22.5 | 22.9 | 25.2 | 19.9 | 2.5 | 4.9 | 1.9 |
| Allegany | 24.1 | 18.7 | 28.2 | 21.1 | 2.1 | 2.8 | 3.0 |
| Finger Lakes | 30.3 | 21.8 | 15.3 | 21.2 | 3.9 | 3.6 | 3.7 |
| Monroe | 33.6 | 20.9 | 11.6 | 21.9 | 4.4 | 4.0 | 3.5 |
| Ontario | 24.7 | 28.1 | 17.3 | 17.6 | 2.7 | 3.0 | 6.6 |
| Wayne | 20.1 | 21.0 | 23.8 | 28.1 | 2.1 | 1.4 | 3.5 |
| Genessee | 27.3 | 23.2 | 23.3 | 17.6 | 2.2 | 2.7 | 3.6 |
| Livingston | 16.5 | 26.0 | 35.6 | 13.9 | 2.1 | 2.0 | 3.8 |
| Wyoming | 16.1 | 19.2 | 33.0 | 20.1 | 3.9 | 3.9 | 3.7 |
| Orleans | 17.4 | 19.7 | 38.2 | 16.6 | 2.4 | 3.1 | 2.6 |
| Seneca | 22.3 | 27.0 | 23.9 | 19.3 | 2.1 | 2.6 | 2.8 |
| Yates | 28.8 | 22.1 | 18.7 | 18.9 | 3.0 | 4.4 | 4.1 |
| Capital | 32.0 | 21.5 | 23.7 | 9.0 | 5.5 | 4.1 | 4.1 |
| Albany | 32.2 | 19.0 | 29.0 | 5.0 | 6.7 | 4.9 | 3.1 |
| Saratoga | 30.1 | 28.7 | 17.6 | 11.0 | 5.3 | 2.4 | 4.9 |
| Schenectady | 34.7 | 21.9 | 15.7 | 15.1 | 3.9 | 3.1 | 5.6 |
| Rensselaer | 35.2 | 20.5 | 21.0 | 9.5 | 4.4 | 3.7 | 5.5 |
| Warren | 35.7 | 25.8 | 13.0 | 12.5 | 5.6 | 3.7 | 3.7 |
| Columbia | 28.5 | 21.8 | 21.4 | 13.0 | 3.8 | 6.8 | 4.6 |
| Washington | 18.3 | 17.8 | 32.5 | 23.5 | 1.8 | 1.8 | 4.2 |
| Greene | 25.4 | 24.3 | 29.3 | 8.5 | 2.9 | 4.6 | 4.8 |
| Central New York | 28.7 | 24.0 | 17.4 | 14.8 | 5.0 | 6.0 | 4.0 |
| Onondaga | 29.9 | 23.9 | 15.4 | 14.3 | 6.0 | 6.3 | 4.2 |
| Oswego | 20.3 | 23.0 | 26.1 | 15.5 | 2.3 | 9.0 | 3.7 |
| Cayuga | 27.1 | 23.0 | 22.0 | 16.4 | 2.2 | 5.7 | 3.5 |
| Madison | 30.7 | 27.1 | 19.1 | 14.7 | 2.9 | 2.0 | 3.4 |
| Cortland | 28.8 | 23.8 | 20.7 | 19.2 | 2.5 | 1.9 | 3.0 |
| Southern Tier | 30.5 | 20.3 | 18.7 | 20.1 | 3.8 | 3.5 | 3.1 |
| Broome | 28.8 | 21.6 | 18.8 | 18.3 | 4.2 | 4.6 | 3.7 |
| Tompkins | 51.8 | 17.1 | 13.1 | 10.5 | 2.9 | 2.7 | 1.7 |
| Steuben | 25.8 | 16.3 | 18.7 | 31.9 | 3.3 | 2.2 | 1.7 |
| Chemung | 25.4 | 24.7 | 17.5 | 19.9 | 3.3 | 3.9 | 5.2 |
| Otsego | 37.1 | 22.5 | 21.1 | 7.5 | 6.3 | 3.7 | 1.8 |
| Delaware | 18.0 | 21.1 | 26.7 | 26.5 | 3.4 | 1.9 | 2.3 |
| Chenango | 19.3 | 17.8 | 23.6 | 24.9 | 5.7 | 4.0 | 4.5 |
| Tioga | 17.4 | 17.5 | 19.3 | 39.5 | 1.9 | 1.2 | 3.0 |
| Schuyler | 26.9 | 24.6 | 25.1 | 16.2 | 1.8 | 2.0 | 3.3 |
| Mohawk Valley | 29.3 | 21.9 | 21.1 | 15.9 | 5.2 | 3.6 | 2.8 |
| Oneida | 33.2 | 21.2 | 19.7 | 13.4 | 6.5 | 3.4 | 2.5 |
| Herkimer | 21.0 | 22.0 | 25.4 | 22.3 | 2.6 | 3.4 | 3.1 |
| Montgomery | 26.1 | 21.4 | 16.8 | 25.2 | 3.7 | 3.6 | 3.0 |
| Fulton | 22.6 | 23.6 | 23.3 | 19.0 | 2.4 | 5.9 | 3.0 |
| Schoharie | 20.2 | 28.5 | 30.1 | 10.4 | 4.4 | 2.0 | 4.2 |
| Hamilton | 24.7 | 22.1 | 36.6 | 3.6 | 2.7 | 2.1 | 7.9 |
| North Country | 25.2 | 22.7 | 28.8 | 12.9 | 2.6 | 3.9 | 3.8 |
| Jefferson | 24.2 | 25.7 | 28.6 | 10.1 | 3.3 | 4.7 | 3.4 |
| St. Lawrence | 24.9 | 22.1 | 28.6 | 14.8 | 2.6 | 2.6 | 4.3 |
| Clinton | 22.7 | 24.1 | 23.2 | 17.1 | 2.0 | 6.7 | 4.0 |
| Franklin | 30.1 | 16.8 | 39.2 | 6.4 | 2.7 | 1.7 | 2.9 |
| Essex | 33.1 | 21.4 | 27.9 | 8.9 | 2.0 | 2.1 | 4.6 |
| Lewis | 14.1 | 19.0 | 34.1 | 23.5 | 2.5 | 2.8 | 3.8 |
|
Note: Based on data for Quarter 3, 2000 to Quarter 2, 2001. Source: NYS Department of Labor. |
|||||||
|
Table 10 |
| WAGE SHARE BY REGION | |||||||
| Services | Trade | Government | Manufacturing | FIRE | Utilities | Construction | |
|
|
|||||||
| STATEWIDE | 29.1 | 12.8 | 14.7 | 11.5 | 22.5 | 5.4 | 3.8 |
|
|
|||||||
| DOWNSTATE | 29.7 | 11.9 | 13.2 | 8.5 | 27.5 | 5.3 | 3.6 |
|
|
|||||||
| New York City | 30.1 | 9.6 | 11.4 | 6.4 | 34.2 | 5.2 | 2.9 |
| New York | 28.6 | 8.3 | 11.5 | 6.2 | 40.6 | 3.4 | 1.3 |
| Queens | 28.5 | 15.2 | 8.3 | 8.7 | 6.6 | 19.5 | 12.9 |
| Kings | 39.7 | 16.3 | 12.2 | 8.1 | 8.1 | 7.9 | 7.2 |
| Bronx | 46.2 | 15.3 | 14.8 | 5.0 | 5.0 | 6.2 | 7.3 |
| Richmond | 42.7 | 14.1 | 11.3 | 2.8 | 5.4 | 12.6 | 10.8 |
| Long Island | 29.3 | 19.9 | 17.9 | 11.0 | 10.5 | 5.6 | 5.6 |
| Nassau | 31.7 | 20.7 | 16.0 | 7.6 | 12.5 | 6.3 | 5.0 |
| Suffolk | 26.7 | 19.0 | 19.9 | 14.6 | 8.3 | 4.9 | 6.4 |
| Mid-Hudson | 27.9 | 15.7 | 18.7 | 18.5 | 7.4 | 5.8 | 5.7 |
| Westchester | 29.4 | 15.6 | 15.2 | 18.5 | 9.2 | 5.9 | 6.2 |
| Orange | 22.8 | 21.4 | 26.3 | 12.7 | 4.7 | 7.0 | 5.0 |
| Dutchess | 25.8 | 11.0 | 19.0 | 30.9 | 4.0 | 4.4 | 4.8 |
| Rockland | 27.7 | 16.5 | 21.1 | 16.5 | 5.8 | 6.9 | 5.3 |
| Ulster | 26.3 | 16.7 | 29.5 | 14.0 | 4.4 | 5.0 | 4.1 |
| Sullivan | 28.9 | 14.1 | 33.7 | 4.3 | 10.7 | 4.6 | 3.6 |
| Putnam | 30.2 | 14.2 | 21.8 | 12.6 | 6.1 | 4.2 | 10.5 |
|
|
|||||||
| UPSTATE | 25.7 | 14.3 | 21.3 | 23.0 | 5.9 | 5.6 | 4.1 |
|
|
|||||||
| Western New York | 24.5 | 14.6 | 19.8 | 24.2 | 6.9 | 5.9 | 4.0 |
| Erie | 26.6 | 15.2 | 18.7 | 21.1 | 8.5 | 5.7 | 4.2 |
| Niagara | 17.7 | 12.3 | 19.9 | 36.2 | 2.5 | 7.1 | 4.2 |
| Chautauqua | 20.4 | 14.0 | 21.7 | 33.1 | 2.3 | 5.3 | 3.2 |
| Cattaraugus | 17.9 | 14.2 | 28.6 | 26.8 | 2.2 | 8.4 | 1.9 |
| Allegany | 19.6 | 9.0 | 32.4 | 30.1 | 1.7 | 3.8 | 3.4 |
| Finger Lakes | 26.1 | 14.3 | 15.4 | 30.4 | 4.7 | 4.9 | 4.2 |
| Monroe | 28.6 | 13.9 | 10.9 | 32.1 | 5.4 | 5.4 | 3.7 |
| Ontario | 21.3 | 18.3 | 21.2 | 22.9 | 3.2 | 4.0 | 9.1 |
| Wayne | 14.8 | 13.7 | 27.6 | 36.1 | 2.0 | 1.7 | 4.2 |
| Genessee | 19.4 | 16.6 | 28.6 | 24.1 | 2.6 | 4.2 | 4.5 |
| Livingston | 12.1 | 16.1 | 45.9 | 16.8 | 1.9 | 2.1 | 5.0 |
| Wyoming | 13.1 | 10.9 | 42.0 | 21.8 | 4.4 | 3.7 | 4.1 |
| Orleans | 12.5 | 10.3 | 49.6 | 19.5 | 2.2 | 3.0 | 2.8 |
| Seneca | 17.5 | 17.4 | 27.4 | 29.1 | 2.2 | 3.1 | 3.1 |
| Yates | 25.8 | 14.9 | 23.2 | 22.4 | 2.9 | 7.2 | 3.6 |
| Capital | 28.4 | 14.3 | 28.0 | 12.8 | 7.1 | 4.9 | 4.6 |
| Albany | 28.2 | 13.0 | 34.3 | 6.2 | 9.0 | 5.6 | 3.5 |
| Saratoga | 25.9 | 20.4 | 21.1 | 17.3 | 6.2 | 3.1 | 5.9 |
| Schenectady | 29.9 | 13.6 | 14.8 | 28.5 | 4.1 | 3.5 | 5.5 |
| Rensselaer | 35.0 | 12.6 | 24.7 | 11.7 | 5.0 | 4.1 | 6.7 |
| Warren | 33.5 | 17.8 | 14.8 | 16.9 | 7.3 | 4.8 | 4.7 |
| Columbia | 25.3 | 15.3 | 25.7 | 14.5 | 4.3 | 9.2 | 5.4 |
| Washington | 12.6 | 10.9 | 39.3 | 29.2 | 1.5 | 2.1 | 4.4 |
| Greene | 18.1 | 16.4 | 39.6 | 11.0 | 4.5 | 5.4 | 4.7 |
| Central New York | 25.1 | 16.5 | 18.1 | 20.5 | 6.6 | 8.5 | 4.6 |
| Onondaga | 26.4 | 17.4 | 15.0 | 20.1 | 8.0 | 8.3 | 4.8 |
| Oswego | 14.3 | 11.2 | 28.9 | 22.1 | 1.8 | 17.9 | 3.7 |
| Cayuga | 22.4 | 14.4 | 28.1 | 20.5 | 2.9 | 7.3 | 4.4 |
| Madison | 28.6 | 19.4 | 23.5 | 18.7 | 3.4 | 2.5 | 3.9 |
| Cortland | 24.4 | 14.2 | 27.3 | 25.2 | 3.3 | 1.9 | 3.6 |
| Southern Tier | 26.0 | 11.4 | 19.1 | 31.4 | 4.3 | 4.5 | 3.3 |
| Broome | 23.4 | 13.0 | 20.8 | 26.7 | 5.0 | 6.6 | 4.3 |
| Tompkins | 56.4 | 8.9 | 13.2 | 12.9 | 3.0 | 4.0 | 1.5 |
| Steuben | 14.5 | 6.4 | 14.5 | 57.4 | 3.8 | 2.0 | 1.2 |
| Chemung | 21.8 | 16.0 | 21.1 | 25.4 | 3.8 | 5.0 | 6.9 |
| Otsego | 38.1 | 14.8 | 23.3 | 8.6 | 7.4 | 5.8 | 1.7 |
| Delaware | 12.2 | 14.1 | 30.1 | 35.2 | 3.3 | 2.3 | 2.9 |
| Chenango | 14.3 | 10.4 | 24.5 | 34.5 | 7.3 | 4.5 | 4.5 |
| Tioga | 8.8 | 8.7 | 15.5 | 62.5 | 1.3 | 1.0 | 2.1 |
| Schuyler | 21.2 | 15.3 | 33.2 | 22.1 | 1.7 | 3.0 | 3.5 |
| Mohawk Valley | 25.1 | 15.4 | 26.6 | 18.5 | 6.2 | 4.8 | 3.4 |
| Oneida | 28.5 | 14.9 | 25.7 | 16.0 | 7.6 | 4.2 | 3.0 |
| Herkimer | 14.8 | 15.1 | 28.4 | 28.5 | 2.7 | 6.3 | 4.2 |
| Montgomery | 24.4 | 15.7 | 18.9 | 29.4 | 4.2 | 3.6 | 3.8 |
| Fulton | 18.8 | 17.0 | 29.0 | 19.7 | 2.9 | 9.0 | 3.5 |
| Schoharie | 14.5 | 19.8 | 40.8 | 10.5 | 5.7 | 3.0 | 5.7 |
| Hamilton | 19.2 | 15.4 | 48.2 | 4.0 | 2.5 | 1.7 | 8.9 |
| North Country | 21.0 | 13.5 | 35.8 | 18.1 | 2.4 | 4.8 | 4.4 |
| Jefferson | 22.4 | 16.9 | 33.9 | 12.8 | 3.4 | 6.5 | 4.1 |
| St. Lawrence | 19.5 | 11.5 | 35.1 | 23.9 | 2.1 | 3.2 | 4.6 |
| Clinton | 19.0 | 14.1 | 30.6 | 22.4 | 1.9 | 7.0 | 4.9 |
| Franklin | 26.4 | 9.9 | 50.4 | 5.8 | 2.3 | 2.5 | 2.5 |
| Essex | 24.6 | 14.2 | 36.7 | 14.3 | 1.9 | 2.6 | 5.5 |
| Lewis | 9.2 | 10.9 | 38.9 | 31.2 | 1.9 | 3.4 | 4.3 |
|
Note: Based on data for Quarter 3, 2000 to Quarter 2, 2001. Source: NYS Department of Labor. |
|||||||
|
Table 11 |
|
EMPLOYMENT GROWTH
1992-2001 |
||||||||
| Region | 1992-2000 | Rank | 1992-1995 | Rank | 1995-2000 | Rank | 2000-2001 | Rank |
|
|
||||||||
| STATEWIDE | 1.3 | 0.5 | 1.8 | 1.5 | ||||
|
|
||||||||
| DOWNSTATE | 1.4 | 0.4 | 2.0 | 1.7 | ||||
|
|
||||||||
| New York City | 1.3 | 2 | 0.2 | 7 | 2.0 | 1 | 1.8 | 1 |
| New York | 1.3 | 23 | (0.4) | 52 | 2.2 | 11 | 2.2 | 11 |
| Queens | 1.3 | 19 | 0.8 | 31 | 1.7 | 24 | 0.5 | 44 |
| Kings | 1.3 | 21 | 1.2 | 20 | 1.3 | 27 | 1.2 | 29 |
| Bronx | 1.1 | 28 | 1.3 | 19 | 0.9 | 35 | 1.2 | 31 |
| Richmond | 3.2 | 3 | 3.9 | 4 | 2.7 | 6 | 1.5 | 22 |
| Long Island | 1.7 | 1 | 1.2 | 2 | 2.0 | 2 | 1.4 | 5 |
| Nassau | 1.2 | 25 | 0.9 | 30 | 1.3 | 26 | 0.7 | 42 |
| Suffolk | 2.3 | 9 | 1.6 | 16 | 2.7 | 7 | 2.1 | 12 |
| Mid-Hudson | 1.2 | 3 | (0.0) | 8 | 1.9 | 3 | 1.8 | 2 |
| Westchester | 1.2 | 24 | 0.3 | 43 | 1.8 | 18 | 1.8 | 16 |
| Orange | 1.7 | 11 | 0.9 | 29 | 2.1 | 12 | 1.9 | 15 |
| Dutchess | 0.5 | 47 | (2.0) | 59 | 2.0 | 16 | 2.6 | 8 |
| Rockland | 1.5 | 15 | 0.8 | 33 | 2.0 | 15 | 1.0 | 34 |
| Ulster | 0.8 | 38 | (2.2) | 60 | 2.5 | 8 | 1.3 | 28 |
| Sullivan | 0.5 | 49 | 0.6 | 39 | 0.4 | 52 | 0.7 | 41 |
| Putnam | 2.7 | 6 | 1.8 | 14 | 3.3 | 2 | 3.2 | 3 |
|
|
||||||||
| UPSTATE | 0.8 | 0.6 | 0.9 | 0.6 | ||||
|
|
||||||||
| Western New York | 0.6 | 9 | 0.6 | 5 | 0.5 | 10 | (0.2) | 10 |
| Erie | 0.7 | 42 | 0.6 | 40 | 0.8 | 40 | 0.0 | 50 |
| Niagara | (0.2) | 59 | 0.5 | 41 | (0.6) | 61 | (1.7) | 60 |
| Chautauqua | 0.8 | 35 | 1.6 | 17 | 0.3 | 53 | (0.2) | 53 |
| Cattaraugus | 0.8 | 36 | 0.2 | 44 | 1.2 | 30 | 0.9 | 37 |
| Allegany | 0.2 | 54 | 1.0 | 24 | (0.3) | 57 | (0.2) | 54 |
| Finger Lakes | 0.9 | 6 | 0.9 | 4 | 0.9 | 7 | 0.5 | 8 |
| Monroe | 0.6 | 44 | 0.6 | 36 | 0.6 | 47 | 0.3 | 48 |
| Ontario | 2.9 | 5 | 2.3 | 11 | 3.3 | 3 | 3.1 | 5 |
| Wayne | 2.2 | 10 | 2.9 | 7 | 1.8 | 19 | (1.8) | 61 |
| Genessee | 0.7 | 41 | 0.8 | 32 | 0.6 | 46 | 1.6 | 21 |
| Livingston | 0.3 | 53 | (1.3) | 56 | 1.2 | 29 | 1.2 | 32 |
| Wyoming | 1.4 | 17 | 4.1 | 2 | (0.3) | 58 | 1.4 | 24 |
| Orleans | 0.2 | 55 | 1.4 | 18 | (0.5) | 60 | (0.8) | 57 |
| Seneca | (0.3) | 61 | (3.6) | 62 | 1.8 | 21 | 0.3 | 47 |
| Yates | 3.4 | 1 | 5.0 | 1 | 2.5 | 9 | 2.9 | 6 |
| Capital | 1.0 | 5 | 0.9 | 3 | 1.1 | 5 | 1.4 | 4 |
| Albany | 0.7 | 39 | 1.0 | 25 | 0.6 | 48 | 0.7 | 40 |
| Saratoga | 3.1 | 4 | 1.9 | 13 | 3.9 | 1 | 4.7 | 2 |
| Schenectady | (0.2) | 60 | (0.4) | 51 | (0.1) | 56 | 1.4 | 26 |
| Rensselaer | 0.9 | 33 | (0.4) | 50 | 1.7 | 23 | 1.6 | 17 |
| Warren | 1.4 | 18 | 3.4 | 6 | 0.2 | 54 | (0.0) | 51 |
| Columbia | 2.6 | 7 | 2.7 | 9 | 2.5 | 10 | 2.7 | 7 |
| Washington | 0.6 | 45 | 0.4 | 42 | 0.7 | 44 | 0.4 | 45 |
| Greene | 1.3 | 22 | (0.0) | 47 | 2.1 | 14 | 1.6 | 20 |
| Central New York | 0.5 | 10 | (0.1) | 9 | 0.8 | 9 | 0.6 | 7 |
| Onondaga | 0.4 | 50 | (0.2) | 49 | 0.7 | 42 | 0.3 | 49 |
| Oswego | (0.2) | 58 | (1.8) | 58 | 0.9 | 36 | 0.8 | 38 |
| Cayuga | 1.3 | 20 | 1.7 | 15 | 1.1 | 33 | 1.6 | 18 |
| Madison | 2.4 | 8 | 3.5 | 5 | 1.8 | 20 | 1.0 | 35 |
| Cortland | (0.8) | 62 | (1.1) | 55 | (0.6) | 62 | 2.4 | 10 |
| Southern Tier | 0.7 | 8 | (0.2) | 10 | 1.2 | 4 | 1.5 | 3 |
| Broome | (0.1) | 56 | (1.6) | 57 | 0.8 | 37 | 1.2 | 30 |
| Tompkins | 1.4 | 16 | 0.9 | 27 | 1.7 | 25 | 1.4 | 25 |
| Steuben | 1.1 | 26 | 0.2 | 45 | 1.7 | 22 | 5.4 | 1 |
| Chemung | 1.0 | 29 | 1.2 | 21 | 0.9 | 34 | (0.5) | 56 |
| Otsego | 1.0 | 32 | 0.7 | 35 | 1.1 | 31 | 1.6 | 19 |
| Delaware | 0.8 | 37 | 0.9 | 26 | 0.7 | 45 | 1.4 | 23 |
| Chenango | 0.5 | 48 | 0.0 | 46 | 0.7 | 41 | 1.3 | 27 |
| Tioga | 1.6 | 13 | (1.1) | 54 | 3.2 | 4 | (0.8) | 58 |
| Schuyler | 0.9 | 34 | 1.1 | 22 | 0.7 | 43 | (2.3) | 62 |
| Mohawk Valley | 1.1 | 4 | 1.5 | 1 | 0.9 | 8 | 0.2 | 9 |
| Oneida | 1.0 | 31 | 0.9 | 28 | 1.1 | 32 | (0.2) | 52 |
| Herkimer | 1.1 | 27 | 2.8 | 8 | 0.1 | 55 | 1.9 | 14 |
| Montgomery | 0.6 | 43 | 2.4 | 10 | (0.4) | 59 | (1.1) | 59 |
| Fulton | 1.0 | 30 | 1.9 | 12 | 0.5 | 50 | 2.1 | 13 |
| Schoharie | 3.3 | 2 | 3.9 | 3 | 2.9 | 5 | 0.7 | 39 |
| Hamilton | (0.1) | 57 | (2.4) | 61 | 1.2 | 28 | 1.1 | 33 |
| North Country | 0.7 | 7 | 0.2 | 6 | 1.0 | 6 | 1.1 | 6 |
| Jefferson | 0.3 | 51 | (0.4) | 53 | 0.8 | 38 | (0.2) | 55 |
| St. Lawrence | 0.3 | 52 | (0.1) | 48 | 0.6 | 49 | 0.3 | 46 |
| Clinton | 0.7 | 40 | 0.6 | 37 | 0.8 | 39 | 2.6 | 9 |
| Franklin | 1.6 | 12 | 1.1 | 23 | 2.0 | 17 | 0.9 | 36 |
| Essex | 1.6 | 14 | 0.8 | 34 | 2.1 | 13 | 3.2 | 4 |
| Lewis | 0.5 | 46 | 0.6 | 38 | 0.5 | 51 | 0.6 | 43 |
|
Note: The growth rates are average annual growth rates. For the 2000-2001 growth rate, data up to the second quarter of 2001 were used. For the ranking of growth rates, number 1 refers to the highest growth rate across all regions. County growth ranks range from 1 to 62. Source: NYS Department of Labor; NYS Assembly Ways and Means Committee staff. |
||||||||
|
Table 12 |
|
WAGE GROWTH 1992-2001 |
||||||||
|
Region |
1992-2000 |
Rank |
1992-1995 |
Rank |
1995-2000 |
Rank |
2000-2001 |
Rank |
|
|
||||||||
| STATEWIDE | 5.7 | 3.1 | 7.3 | 6.7 | ||||
|
|
||||||||
| DOWNSTATE | 6.2 | 3.0 | 8.0 | 7.4 | ||||
|
|
||||||||
| New York City | 6.6 | 1 | 3.2 | 4 | 8.7 | 1 | 8.0 | 1 |
| New York | 7.4 | 2 | 3.1 | 32 | 9.9 | 2 | 8.8 | 2 |
| Queens | 3.9 | 29 | 2.5 | 44 | 4.8 | 23 | 5.0 | 19 |
| Kings | 3.8 | 32 | 3.9 | 19 | 3.7 | 40 | 4.1 | 31 |
| Bronx | 3.2 | 43 | 3.1 | 34 | 3.3 | 49 | 4.5 | 26 |
| Richmond | 6.5 | 3 | 6.4 | 5 | 6.6 | 8 | 4.5 | 25 |
| Long Island | 5.2 | 2 | 3.4 | 2 | 6.3 | 3 | 4.9 | 4 |
| Nassau | 4.5 | 16 | 2.6 | 42 | 5.7 | 15 | 3.3 | 40 |
| Suffolk | 6.0 | 7 | 4.3 | 15 | 7.0 | 5 | 6.6 | 13 |
| Mid-Hudson | 4.7 | 3 | 1.6 | 10 | 6.6 | 2 | 7.1 | 2 |
| Westchester | 5.6 | 11 | 2.4 | 47 | 7.5 | 3 | 8.4 | 4 |
| Orange | 4.0 | 28 | 2.1 | 48 | 5.1 | 22 | 4.6 | 23 |
| Dutchess | 3.3 | 42 | (1.4) | 59 | 6.0 | 13 | 7.2 | 8 |
| Rockland | 4.5 | 17 | 3.4 | 28 | 5.2 | 19 | 5.7 | 17 |
| Ulster | 1.5 | 61 | (4.7) | 62 | 5.1 | 21 | 1.8 | 54 |
| Sullivan | 3.2 | 44 | 2.7 | 39 | 3.5 | 44 | 4.7 | 22 |
| Putnam | 5.6 | 10 | 4.3 | 16 | 6.4 | 9 | 10.0 | 1 |
|
|
||||||||
| UPSTATE | 3.7 | 3.0 | 4.2 | 3.5 | ||||
|
|
||||||||
| Western New York | 3.7 | 6 | 3.7 | 1 | 3.7 | 8 | 1.6 | 10 |
| Erie | 4.0 | 27 | 3.8 | 23 | 4.1 | 31 | 2.0 | 51 |
| Niagara | 2.8 | 53 | 3.6 | 25 | 2.3 | 60 | (1.6) | 61 |
| Chautauqua | 3.3 | 41 | 3.8 | 22 | 2.9 | 53 | 1.7 | 55 |
| Cattaraugus | 3.3 | 39 | 2.8 | 38 | 3.6 | 41 | 3.0 | 45 |
| Allegany | 2.7 | 54 | 2.9 | 37 | 2.6 | 57 | 3.7 | 36 |
| Finger Lakes | 3.4 | 9 | 3.4 | 3 | 3.4 | 10 | 3.1 | 7 |
| Monroe | 3.2 | 45 | 3.1 | 33 | 3.2 | 51 | 3.0 | 46 |
| Ontario | 6.2 | 6 | 5.8 | 7 | 6.4 | 10 | 6.0 | 15 |
| Wayne | 4.5 | 18 | 4.6 | 10 | 4.4 | 27 | (1.1) | 60 |
| Genessee | 3.0 | 48 | 3.0 | 36 | 2.9 | 54 | 3.2 | 42 |
| Livingston | 2.8 | 52 | 1.7 | 51 | 3.5 | 43 | 3.4 | 39 |
| Wyoming | 4.4 | 21 | 6.5 | 3 | 3.1 | 52 | 4.0 | 32 |
| Orleans | 3.3 | 40 | 6.6 | 2 | 1.3 | 62 | 3.4 | 38 |
| Seneca | 1.5 | 60 | (0.8) | 58 | 2.8 | 56 | 4.2 | 29 |
| Yates | 6.3 | 5 | 6.7 | 1 | 6.0 | 14 | 7.5 | 6 |
| Capital | 4.3 | 4 | 2.9 | 7 | 5.2 | 5 | 6.4 | 3 |
| Albany | 4.4 | 22 | 3.0 | 35 | 5.2 | 20 | 6.8 | 10 |
| Saratoga | 5.7 | 9 | 3.4 | 29 | 7.1 | 4 | 8.1 | 5 |
| Schenectady | 2.9 | 50 | 1.8 | 50 | 3.5 | 45 | 4.1 | 30 |
| Rensselaer | 5.1 | 12 | 2.4 | 45 | 6.7 | 6 | 8.5 | 3 |
| Warren | 3.8 | 31 | 4.4 | 12 | 3.5 | 46 | 2.3 | 49 |
| Columbia | 5.9 | 8 | 5.1 | 8 | 6.4 | 11 | 7.3 | 7 |
| Washington | 2.9 | 49 | 1.5 | 52 | 3.8 | 39 | 3.8 | 35 |
| Greene | 4.4 | 20 | 2.4 | 46 | 5.6 | 16 | 6.9 | 9 |
| Central New York | 3.2 | 10 | 2.4 | 8 | 3.7 | 9 | 2.6 | 9 |
| Onondaga | 3.4 | 38 | 2.6 | 41 | 3.8 | 38 | 2.4 | 48 |
| Oswego | 0.9 | 62 | (1.6) | 60 | 2.4 | 59 | 1.5 | 56 |
| Cayuga | 4.4 | 19 | 4.4 | 11 | 4.4 | 28 | 4.5 | 24 |
| Madison | 5.0 | 13 | 6.5 | 4 | 4.1 | 30 | 3.1 | 44 |
| Cortland | 2.5 | 57 | 0.6 | 55 | 3.6 | 42 | 6.7 | 12 |
| Southern Tier | 4.2 | 5 | 1.8 | 9 | 5.6 | 4 | 3.8 | 6 |
| Broome | 2.2 | 58 | (0.7) | 56 | 3.9 | 37 | 3.9 | 34 |
| Tompkins | 4.9 | 15 | 3.9 | 21 | 5.5 | 18 | 4.2 | 28 |
| Steuben | 9.2 | 1 | 3.3 | 30 | 12.7 | 1 | 6.0 | 16 |
| Chemung | 4.2 | 25 | 4.4 | 13 | 4.0 | 33 | 2.3 | 50 |
| Otsego | 3.8 | 33 | 3.6 | 26 | 3.9 | 36 | 3.2 | 41 |
| Delaware | 4.0 | 26 | 3.2 | 31 | 4.5 | 25 | (2.0) | 62 |
| Chenango | 2.6 | 55 | 1.1 | 54 | 3.5 | 48 | 5.4 | |
| Tioga | 3.6 | 34 | (0.7) | 57 | 6.2 | 12 | 2.8 | 47 |
| Schuyler | 3.4 | 37 | 4.3 | 14 | 2.8 | 55 | 1.1 | 58 |
| Mohawk Valley | 3.6 | 8 | 3.1 | 5 | 3.9 | 7 | 2.9 | 8 |
| Oneida | 3.5 | 36 | 2.5 | 43 | 4.1 | 29 | 3.2 | 43 |
| Herkimer | 3.1 | 46 | 4.7 | 9 | 2.2 | 61 | 4.8 | 20 |
| Montgomery | 3.1 | 47 | 4.1 | 17 | 2.5 | 58 | 1.2 | 57 |
| Fulton | 3.8 | 30 | 3.5 | 27 | 4.0 | 34 | 1.0 | 59 |
| Schoharie | 6.5 | 4 | 6.3 | 6 | 6.7 | 7 | 4.0 | 33 |
| Hamilton | 1.8 | 59 | (1.9) | 61 | 4.0 | 35 | 4.4 | 27 |
| North Country | 3.7 | 7 | 2.9 | 6 | 4.2 | 6 | 4.2 | 5 |
| Jefferson | 2.9 | 51 | 1.8 | 49 | 3.5 | 47 | 1.8 | 53 |
| St. Lawrence | 3.5 | 35 | 2.7 | 40 | 4.1 | 32 | 3.7 | 37 |
| Clinton | 4.2 | 24 | 3.9 | 20 | 4.4 | 26 | 6.8 | 11 |
| Franklin | 5.0 | 14 | 4.1 | 18 | 5.5 | 17 | 4.7 | 21 |
| Essex | 4.3 | 23 | 3.7 | 24 | 4.6 | 24 | 6.6 | 14 |
| Lewis | 2.5 | 56 | 1.2 | 53 | 3.3 | 50 | 1.9 | 52 |
|
Note: The growth rates are average annual growth rates. For the 2000-2001 growth rate, data up to the second quarter of 2001 were used. For the ranking of growth rates, number 1 refers to the highest growth rate across all regions. County growth ranks range from 1 to 62. Source: NYS Department of Labor; NYS Assembly Ways and Means Committee staff. |
||||||||
|
|
|
Fiscal Year Forecasts The forecasts appearing in this report have been done on a calendar year basis in order to be comparable with most outside economic forecasts. However, it should be noted that due in part to the timing of the attack, there is a significant difference between fiscal year and calendar year growth rates for this forecast. Table 13 shows both calendar year and fiscal year forecasts for key New York State variables. |
|
Table 13 |
|
EMPLOYMENT AND WAGE GROWTH
New York State |
||
|
Employment
(Percent Change) |
Wages
(Percent Change) |
|
| Calendar Year | ||
| 2000 | 2.2 | 9.9 |
| 2001 | (0.1) | 3.9 |
| 2002 | (0.7) | 0.7 |
| Fiscal Year | ||
| 2000-2001 | 2.0 | 8.6 |
| 2001-2002 | (0.8) | (0.7) |
| 2002-2003 | (0.1) | 3.9 |
|
Note: Fiscal year goes from second quarter to first quarter. For example, FY 2000-2001 is from April 2000 to March 2001. Source: NYS Assembly Ways and Means Committee staff estimates. |
||
|
|
|
Table 14 |
|
UNITED STATES ECONOMIC OUTLOOK
(Dollar Amounts in Billions) |
|||
| Actual | Preliminary | Forecast | |
| 2000 | 2001 | 2002 | |
| Real GDP | $9,224.0 | $9,332.3 | $9,470.8 |
| % Change | 4.1 | 1.2 | 1.5 |
| Real Consumption | $6,257.8 | $6,449.8 | $6,571.9 |
| % Change | 4.8 | 3.1 | 1.9 |
| Real Investment | $1,772.9 | $1,631.3 | $1,687.7 |
| % Change | 6.8 | (8.0) | 3.5 |
| Real Exports | $1,133.2 | $1,080.8 | $1,021.9 |
| % Change | 9.5 | (4.6) | (5.4) |
| Real Imports | $1,532.3 | $1,491.0 | $1,496.4 |
| % Change | 13.4 | (2.7) | 0.4 |
| Government | $1,572.6 | $1,628.6 | $1,688.6 |
| % Change | 2.7 | 3.6 | 3.7 |
| Federal | $545.9 | $560.4 | $589.8 |
| % Change | 1.7 | 2.7 | 5.2 |
| State and Local | $1,026.3 | $1,067.4 | $1,098.9 |
| % Change | 3.2 | 4.0 | 2.9 |
| Personal Income | $8,319.1 | $8,723.8 | $8,964.1 |
| % Change | 7.0 | 4.9 | 2.8 |
| Wages & Salaries | $4,837.2 | $5,098.2 | $5,233.0 |
| % Change | 8.2 | 5.4 | 2.6 |
| Transfer Income | $1,069.1 | $1,148.8 | $1,224.7 |
| % Change | 4.9 | 7.5 | 6.6 |
| Profits | $845.3 | $709.3 | $767.2 |
| % Change | 8.9 | (16.1) | 8.2 |
| Productivity | 117.3 | 119.4 | 121.7 |
| % Change | 3.4 | 1.7 | 2.0 |
| Employment 1 | 131.8 | 132.2 | 131.7 |
| % Change | 2.2 | 0.4 | (0.4) |
| CPI-Urban | 172.3 | 177.2 | 179.8 |
| % Change | 3.4 | 2.8 | 1.5 |
| S&P 500 | 1,426.8 | 1,191.3 | 1,223.0 |
| % Change | 7.6 | (16.5) | 2.7 |
|
Treasury Bill Rate
(3 month) 2 |
5.8 | 3.4 | 2.1 |
|
Treasury Bond Rate
(10 year) 2 |
6.0 | 5.0 | 5.1 |
|
1 In millions. 2 Annual average rate. Source: DRI-WEFA; NYS Assembly Ways and Means Committee staff. |
|||
|
Table 15 |
|
UNITED STATES EMPLOYMENT BY SECTOR
(Employment in Millions) |
|||
| Actual | Preliminary | Forecast | |
|
2000
|
2001
|
2002
|
|
| TOTAL | 131.8 | 132.2 | 131.7 |
| % Change | 2.2 | 0.4 | (0.4) |
| Services | 40.5 | 41.0 | 41.3 |
| % Change | 3.6 | 1.4 | 0.7 |
| Retail Trade | 23.3 | 23.5 | 23.2 |
| % Change | 2.0 | 0.8 | (1.4) |
| Government | 20.7 | 20.9 | 21.2 |
| % Change | 2.4 | 0.9 | 1.4 |
| Manufacturing 1 | 18.5 | 17.7 | 17.0 |
| % Change | (0.5) | (4.2) | (3.7) |
| F.I.R.E. | 7.6 | 7.6 | 7.7 |
| % Change | 0.1 | 0.8 | 0.7 |
| Utilities 2 | 7.0 | 7.1 | 6.9 |
| % Change | 2.7 | 0.7 | (1.8) |
| Wholesale Trade | 7.0 | 7.0 | 6.9 |
| % Change | 1.6 | (0.1) | (0.9) |
| Construction | 6.7 | 6.9 | 6.9 |
| % Change | 4.5 | 2.5 | 1.0 |
|
1 Including Mining. 2 Transportation, Communication, Public Utilities. Source: DRI-WEFA; NYS Assembly Ways and Means Committee staff. |
|||
|
Table 16 |
|
NEW YORK STATE ECONOMIC INDICATORS
(Dollar Amounts in Billions; Employment in Thousands) |
|||
| Actual | Preliminary | Forecast | |
| 2000 | 2001 | 2002 | |
| PERSONAL INCOME | $640.6 | $663.2 | $669.0 |
| % Change | 6.6 | 3.5 | 0.9 |
| Wages and Salaries | $384.2 | $399.2 | $402.0 |
| % Change | 9.9 | 3.9 | 0.7 |
| TOTAL EMPLOYMENT | 8,439.8 | 8,433.1 | 8,372.7 |
| % Change | 2.2 | (0.1) | (0.7) |
| Services | 2,922.3 | 2,951.8 | 2,982.3 |
| % Change | 3.7 | 1.0 | 1.0 |
| Trade | 1,738.4 | 1,723.5 | 1,694.7 |
| % Change | 2.0 | (0.9) | (1.7) |
| Government | 1,385.7 | 1,384.6 | 1,385.6 |
| % Change | 1.6 | (0.1) | 0.1 |
| Manufacturing | 878.1 | 843.4 | 806.5 |
| % Change | (1.8) | (3.9) | (4.4) |
| F.I.R.E. | 744.5 | 735.5 | 715.1 |
| % Change | 0.2 | (1.2) | (2.8) |
| Utilities | 424.1 | 423.0 | 409.6 |
| % Change | 2.9 | (0.3) | (3.2) |
| Construction | 327.6 | 336.5 | 348.9 |
| % Change | 5.7 | 2.7 | 3.7 |
| CPI | 182.5 | 187.2 | 190.2 |
| % Change | 3.1 | 2.6 | 1.6 |
|
Source: DRI-WEFA; NYS Assembly Ways and Means Committee staff estimates. |
|||
|
New York State Assembly [ Home Page ] [ Legislative Reports ] [ Committee Reports ] |