Revenue & Economic
Report
|
|
|
2003-04 Revenue & Economic Report |
| A Forecast of State Tax Revenue |
|
|
|
Charles H. Nesbitt Assembly Minority Leader |
Thomas F. Barraga Ranking Minority Member Assembly Ways & Means Committee |
|
Rebecca P. D'Agati Minority Staff Director Assembly Ways & Means Committee |
|
Steven M. Lowenstein Senior Fiscal Economist |
William M. Sherman, II Deputy Director |
New York State Legislature Assembly Ways and Means Committee - Minority February 2003 |
|
|
|
|
Assembly Ways & Means Committee Minority Membership Thomas F. Barraga Ranking Member |
|||
James P. Hayes Howard D. Mills Willis H. Stephens, Jr. Fred W. Thiele, Jr. |
Thomas J. Kirwan Michael J. Spano Robert A. Straniere George H. Winner, Jr. |
||
|
|
| Contents |
|
|
| I. Executive Summary |
|
State fiscal year 2003-04 will be another difficult year for New York State. Estimates provided as part of the 2003-04 Executive Budget project that without any action, New York faces a $2.2 billion dollar deficit for the remainder of SFY 2002-03, and a budget gap of $9.3 billion for the 2003-04 SFY. These budget gaps have followed actions taken since October 2001, which have closed budget shortfalls totaling $8.8 billion for the 2001-02 and 2002-03 SFYs. The majority of the State's current financial difficulties can be attributed to events that are beyond the control of the State. The U.S. economy slipped into recession in early 2001 at the same time the high-tech bubble burst. This led to what has turned out to be a long downturn in the financial markets. Furthermore, on September 11, 2001, terrorists attacked and destroyed the World Trade Center in downtown Manhattan, which in turn dealt a crushing blow to the State's finances. As SFY 2003-04 approaches, New York continues to be impacted by this series of events, which have hit New York harder than most other States. However, New York is not alone in facing these financial difficulties. In a report issued in February 2003, the National Conference of State Legislatures reported that 36 states are facing a cumulative budget gap of approximately $25.7 billion for FY 2003 and that at least 36 states face budget gaps for FY 2004. The cumulative total for the 36 states that have already indicated they face budget gaps in FY 2004 is $68.7 billion. New York's fiscal difficulties would have been much worse had the State not entered the 2001-02 SFY in the best financial condition in decades. Numerous tax cuts implemented in the second half of the 1990's drastically improved the State's business climate, which helped cushion the impact of the national recession. The State also entered this period with a record level of reserves, which were increased from a mere $158 million in 1993-94 to nearly $2.6 billion in 2001-02. These reserves have been used to off-set part of the revenue loss suffered due to the World Trade Center attack and the national recession. |
|
|
| All Funds Revenues | ||||
| (millions of dollars) | ||||
|
2002-03
|
||||
|
Executive Budget |
Minority Ways & Means |
Variance | ||
|
|
||||
| Personal Income Tax | 24,005 | 23,878 | (127) | |
| Consumption and Use Taxes | 10,787 | 10,845 | 58 | |
| Business Taxes | 5,036 | 5,049 | 13 | |
| Other Taxes | 1,210 | 1,237 | 28 | |
|
|
||||
| Total Taxes | 41,038 | 41,009 | (29) | |
|
2003-04 |
||||
|
Executive Budget |
Minority Ways & Means |
Variance | ||
|
|
||||
| Personal Income Tax | 23,059 | 22,557 | (502) | |
| Consumption and Use Taxes | 11,462 | 11,426 | (36) | |
| Business Taxes | 5,236 | 5,251 | 15 | |
| Other Taxes | 1,176 | 1,220 | 44 | |
|
|
||||
| Total Taxes | 40,933 | 40,455 | (478) | |
| Note: Totals may not equal due to rounding. | ||||
|
|
|
Economic Outlook The current economic slowdown is expected to continue through much of 2003. The Assembly Minority Ways & Means Committee projects that the U.S. economy will grow at an average of 2.0 percent during the first three quarters of 2003, before the economy picks up in the fourth quarter. Employment levels will begin to increase in 2003, after falling in 2002. The continuation of the U.S. economic slowdown will continue to impact the New York economy. After a unique series of events (a prolonged downturn in the financial markets, a national manufacturing recession, and a terrorist attack on the World Trade Center) triggered a downturn in the New York economy in 2001, the economy continued to struggle in 2002. A full recovery in New York's economy is not projected to occur until the U.S. economy picks up and there is a recovery in the financial markets. There continues to be significant potential risks to the economy. These risks pose the potential of further disrupting the economy and the State's tax revenue streams. Among the risks are: an extended conflict with Iraq; a severe spike in oil prices; and the potential of an additional terrorist attack on U.S. soil. The Forecast In developing this forecast, the Committee has utilized the Washington University Macro Model of the United State economy, developed and maintained by Macroeconomic Advisers, LLC. The Committee has also utilized New York State economic data and forecasts from Economy.com to supplement the Committee's in-house model of the State economy. |
|
|
| General Fund Revenues | ||||
| (millions of dollars) | ||||
|
2002-03
|
||||
|
Executive Budget |
Minority Ways & Means |
Variance | ||
|
|
||||
| Personal Income Tax | 17,070 | 16,973 | (97) | |
| Consumption and Use Taxes | 7,052 | 7,083 | 31 | |
| Business Taxes | 3,472 | 3,454 | (18) | |
| Other Taxes | 761 | 783 | 22 | |
|
|
||||
| Total Taxes | 28,355 | 28,293 | (62) | |
|
2003-04 |
||||
|
Executive Budget |
Minority Ways & Means |
Variance | ||
|
|
||||
| Personal Income Tax | 15,254 | 14,878 | (377) | |
| Consumption and Use Taxes | 7,508 | 7,481 | (27) | |
| Business Taxes | 3,682 | 3,693 | 11 | |
| Other Taxes | 771 | 795 | 24 | |
|
|
||||
| Total Taxes | 27,215 | 26,846 | ss="tab1"> (369) | |
| Note: Totals may not equal due to rounding. | ||||
|
|
|
Revised FY 2002-03 Projections
FY 2003-04 Projections The Committee is forecasting General Fund tax collections of $26.85 billion in 2003-04, a decline of $1.45 billion, or 5.1 percent from 2002-03. This decline is due to the use of $1.25 billion from the Refund Reserve Account in 2002-03 and the full year impact of the Revenue Bond Tax Fund transfer. After adjusting for these transactions, General Fund collections are projected to increase by $618.8 million, or 1.8 percent in 2003-04. The Committee's estimate of General Fund collections is $369 million below the Division of the Budget. Adjusted for the Revenue Bond Tax Fund transfer, the Committees projections for 2003-04 are $494 million below the Executive.
Need for Fiscal Restraint The Committee once again emphasizes the need to utilize revenue projections for the entire three year State Financial Plan period. In this report, the Committee has built on last year's report by providing outyear All Funds and economic projections, in addition to out-year estimates of General Fund tax receipts. Increasing the scope of the forecast discussion can only lead to improvements in the State's budgeting process. |
|
|
| II. The U.S. Economy |
|
The U.S. economy slowly began to recover in 2002 from the recession of 2001, but the lingering impact of the bursting of the high-tech bubble continued to be a drag on the economy. New concerns over possible military action against Iraq, a continued increase in unemployment, and a drop in consumer confidence slowed economic growth to a crawl by the fourth quarter of 2002. Personal consumption expenditures, which had remained strong early in the recession, grew by just 1.0 percent during the fourth quarter, the slowest rate of growth during the current economic slowdown.
Economic Activity in 2002
|
|
|
| Components of Real Gross Domestic Product | ||||||
| (chained 1996 dollars, annual percent change) | ||||||
| 2000 | 2001 | 2002 | 2003* | 2004* | 2005* | |
|
|
||||||
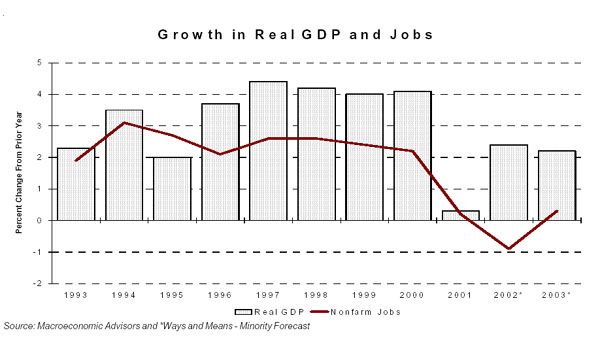
| Real GDP | 3.8 | 0.3 | 2.4 | 2.2 | 3.7 | 3.5 |
| Total Consumption | 4.3 | 2.5 | 3.1 | 2.0 | 2.8 | 2.8 |
| Nonresidential Fixed Investment | 7.8 | (5.2) | (5.8) | 1.1 | 9.9 | 9.8 |
| Residential Fixed Investment | 1.1 | 0.3 | 3.8 | 0.8 | 4.7 | (1.5) |
| Exports | 9.7 | (5.4) | (1.3) | 5.4 | 9.1 | 9.1 |
| Imports | 13.2 | (2.9) | 3.5 | 4.9 | 5.5 | 3.6 |
| Federal Gov't Expenditures | 1.3 | 4.8 | 7.4 | 7.4 | 1.9 | 0.1 |
| State & Local Gov't Expenditures | 3.5 | 3.1 | 2.9 | 0.8 | 0.0 | 1.0 |
| Source: Macroeconomic Advisers and *Ways and Means - Minority Forecast | ||||||
|
|
|
U.S. Outlook Following continued job loss in the first quarter of 2003, the U.S. labor market will begin to recover in the second quarter. After falling by an annual rate of 0.7 percent in the first quarter, non-agricultural employment growth will increase to an annual rate of 2.1 percent by the fourth quarter. On an annual basis, the U.S. economy will add 432,000 new jobs in 2003, an increase of 0.3 percent. This increase follows a 0.9 percent job loss in 2002. On a fourth quarter to fourth quarter basis, U.S. non-farm employment will increase by 0.9 percent, adding back 1.12 million jobs. The unemployment rate will continue to rise through the second quarter of 2003, peaking at 6.4 percent. The Committee projects that the unemployment rate will average 6.3 percent for 2003, after averaging 5.8 percent in 2002. The unemployment rate will steadily decline through the second half of 2003 and continue to decline in 2004, averaging 5.8 percent for 2004. After falling in the fourth quarter of 2002, the Committee estimates that industrial production will increase by 1.6 percent in 2003. Manufacturing activity is also projected to pick up in 2003, increasing by 1.7 percent. Inflation will remain moderate in 2003; however, higher energy prices will introduce some inflationary pressure into the economy. The Committee projects that the All-Urban Consumer Price Index will increase by 2.5 percent, following a 1.6 percent increase in 2002. The Federal Reserve is expected to overlook the increase in energy prices, and maintain the federal funds rate at 1.25 percent through most of the year. The Fed is expected to raise interest rates late in 2003 as the U.S. economy begins to show signs of stronger growth. Corporate profits in 2003 are projected to remain relatively flat from 2002 levels. The Committee projects that after a decline in the second quarter of 2003, pre-tax profitability will improve as the U.S. economy picks up later in the year. |
|
|
| Components of Real Gross Domestic Product | ||||||
|
State Fiscal Year (chained 1996 dollars, annual percent change) |
||||||
| State Fiscal Year ending in: | ||||||
| 2001 | 2002 | 2003* | 2004* | 2005* | 2006* | |
|
|
||||||
| Real GDP | 3.1 | 0.3 | 2.5 | 2.6 | 3.7 | 3.5 |
| Total Consumption | 3.8 | 2.5 | 2.8 | 2.2 | 2.7 | 2.8 |
| Nonresidential Fixed Investment | 5.9 | (7.8) | (3.6) | 3.2 | 10.7 | 8.9 |
| Residential Fixed Investment | (0.2) | 1.2 | 3.9 | 0.6 | 4.7 | (3.9) |
| Exports | 8.4 | (8.5) | 2.5 | 6.1 | 9.3 | 8.9 |
| Imports | 11.0 | (5.1) | 6.7 | 4.1 | 5.4 | 2.8 |
| Federal Gov't Expenditures | 2.1 | 5.4 | 7.5 | 6.7 | 0.6 | 0.3 |
| State & Local Gov't Expenditures | 2.9 | 3.6 | 2.1 | 0.4 | 0.3 | 1.1 |
| Source: Macroeconomic Advisers and *Ways and Means - Minority Forecast | ||||||
|
|
| Forecasts of the U.S. Economy | ||||||
| (annual percent changes, unless otherwise noted) | ||||||
| 2000 | 2001 | 2002 | 2003* | 2004* | 2005* | |
|
|
||||||
| Real Gross Domestic Product (96 Chain) | 3.8 | 0.3 | 2.4 | 2.2 | 3.7 | 3.5 |
| Inflation (CPI - All Consumers) | 3.4 | 2.8 | 1.6 | 2.5 | 1.8 | 2.2 |
| Unemployment Rate | 4.0 | 4.8 | 5.8 | 6.3 | 5.8 | 5.4 |
| Nonagricultural Employment | 2.2 | 0.2 | (0.9) | 0.3 | 2.0 | 2.1 |
| 10-Year Treasury Bond Yield | 6.0 | 5.0 | 4.6 | 4.2 | 4.7 | 5.2 |
| 3-Month Treasury Bill Rate | 5.8 | 3.4 | 1.6 | 1.3 | 2.4 | 3.8 |
| Personal Income | 8.0 | 3.3 | 3 | 4.0 | 4.9 | 5 |
| Industrial Production | 4.7 | (3.5) | (0.7) | 1.6 | 5.1 | 4.5 |
| Change in Inventories (billions of dollars) | 254.2 | (241.4) | (5.9) | 83.2 | 194.0 | 214.8 |
| Pre-Tax Corporate Profits | 2.7 | (14.3) | (2.9) | (0.2) | 26.3 | 27.1 |
| S & P 500 Stock Index | 7.6 | (16.5) | (16.6) | (10.2) | 24.9 | 16.9 |
|
State Fiscal Year (annual percent changes, unless otherwise noted) |
||||||
| State Fiscal Year ending in: | ||||||
| 2001 | 2002 | 2003* | 2004* | 2005* | 2006* | |
|
|
||||||
| Real Gross Domestic Product (96 Chain) | 3.1 | 0.3 | 2.5 | 2.6 | 3.7 | 3.5 |
| Inflation (CPI - All Consumers) | 3.4 | 2.3 | 2.0 | 2.2 | 1.9 | 2.4 |
| Unemployment Rate | 4.1 | 5.1 | 5.9 | 6.2 | 5.7 | 5.4 |
| Nonagricultural Employment | 1.8 | (0.4) | (0.6) | 0.7 | 2.1 | 2.0 |
| 10-Year Treasury Bond Yield | 5.7 | 5.0 | 4.3 | 4.3 | 4.8 | 5.3 |
| 3-Month Treasury Bill Rate | 5.6 | 2.6 | 1.5 | 1.4 | 2.8 | 4.0 |
| Personal Income | 7.5 | 2.4 | 3.6 | 4.1 | 5.0 | 5.0 |
| Industrial Production | 3.3 | (4.4) | 0.7 | 2.4 | 5.2 | 4.4 |
| Change in Inventories (billions of dollars) | 180.2 | (244.1) | 43.3 | 104.6 | 207.3 | 215.1 |
| Pre-Tax Corporate Profits | (2.0) | (14.0) | 0.0 | 3.2 | 30.8 | 22.1 |
| S & P 500 Stock Index | 1.8 | (16.3) | (23.4) | 3.6 | 25.0 | 14.4 |
| Source: Macroeconomic Advisers and *Ways and Means - Minority Forecast | ||||||
|
|
|
Risks to the Forecast Potential risks to the economy include:
|
|
|
| III. The New York State Economy |
|
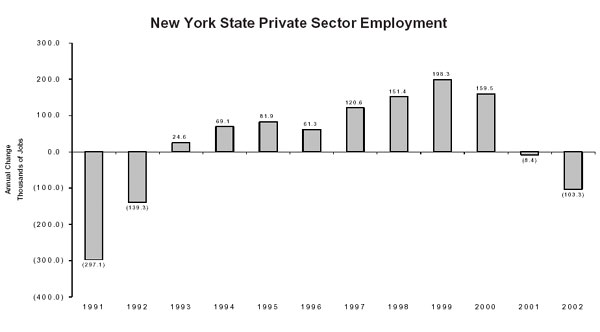
A unique set of events has resulted in the 2001 U.S. economic recession having a greater and prolonged impact on the New York State economy than many other areas of the country. A prolonged decline in the U.S. equity markets effected the Downstate economy at the same time that the Upstate manufacturing economy was being impacted by the national manufacturing recession. These economic conditions were exacerbated by the September 11, 2001 terrorist attack which destroyed the World Trade Center in downtown Manhattan. Seasonally adjusted non-agricultural employment in New York State peaked in January of 2001. Since that peak, New York has lost 170,000 jobs. The manufacturing and finance, insurance, and real estate sectors have been hard hit by the current economic downturn. Manufacturing employment has declined by 90,000, or 10.3 percent, since January 2001. The FIRE sector has lost 29,600 jobs since September 2001, representing four percent of the FIRE workforce. Employment in the services sector has fared much better. The service sector had lost 31,400 jobs, a decline of 1.0 percent from its peak in January 2001; however, employment in this sector has been growing since February 2002 and has regained almost all of the lost jobs. On a December to December basis, the New York State economy lost 44,800 jobs in 2002. The overwhelming majority of those job losses occurred in New York City, which lost 43,400 non-agricultural jobs between December 2001 and December 2002. Employment declines continued in the FIRE sector and in manufacturing in 2002. FIRE employment fell by 1.0 percent (7,200 jobs), while manufacturing employment fell by 0.6 percent (19,700 jobs). Employment in the services sector increased by 36,500, or 4.5 percent, from December 2001 to December 2002. The State's unemployment rate continued to rise in 2002, reaching 6.1 percent in December 2002. The average unemployment rate for 2002 was 6.0 percent, up from 4.9 percent in 2001. Personal income in 2002 rose by 1.0 percent, with wage and salary disbursements increasing by just 0.4 percent. The State's output, measured by Real Gross State Product increased by 2.0 percent.
The New York State Outlook The Committee projects that the New York labor market will continue to constrict during the first half of 2003. On an annual basis, total non-agricultural employment is projected to decline by 0.2 percent. However, the Committee anticipates job growth to resume in the third quarter of 2003, with total employment in the fourth quarter of 2003 exceeding the level of employment in the fourth quarter of 2002. New York personal income is projected to increase modestly in 2003. Growth of 2.2 percent in 2003 precedes a return to healthier growth in 2004 of 4.1 percent. Wage and salary disbursements are projected to increase by 2.9 percent and 5.3 percent in 2003 and 2004, respectively. The performance of the stock market is a vital determinate in the fortunes of the New York economy. The Committee is projecting that, after a small rebound in stock prices in the second quarter, stocks will once again decline in the third quarter of 2003 as a result of disappointing second quarter corporate earnings. A full recovery in stock prices will begin in the fourth quarter of 2003, with stock prices ending the year near their closing value at the end of last year. However, this delay in the stock market recovery will prevent the New York economy from fully recovering in 2003 from the current economic slowdown. |
|
|
| Forecasts of the New York State Economy | ||||||
| (annual percent changes, unless otherwise noted) | ||||||
| 2000 | 2001 | 2002* | 2003* | 2004* | 2005* | |
|
|
||||||
| Real Gross State Product | 6.6 | 1.8 | 2.0 | 2.6 | 3.6 | 3.7 |
| Personal Income | 8.0 | 3.0 | 0.4 | 2.2 | 4.1 | 4.6 |
| Wages and Salaries | 9.8 | (1.0) | 1.0 | 2.9 | 5.3 | 5.2 |
| Nonagricultural Employment | 2.1 | 0.0 | (1.1) | (0.2) | 1.0 | 1.2 |
| Unemployment Rate | 4.6 | 4.9 | 6.0 | 6.2 | 5.9 | 5.6 |
| Average Wage | 7.5 | 2.4 | (0.2) | 2.6 | 4.0 | 4.0 |
| Source: Economy.com and *Ways and Means - Minority Forecast | ||||||
|
|
|
The Security Industry in 2002 Profits of the securities industry fell to an eight year low in 2003, estimated at $7.0 billion prior to a $2.2 billion write-off in the fourth quarter of 2002 associated with the settlement of litigation brought against the industry. Including this write-off, reported pre-tax profits are estimated at $4.8 billion. The value of initial public offerings fell to a 10 year low in 2002, at $25.8 billion, compared to a record $75.8 billion in 2000. IPO deal volume fell to the lowest level since 1978. Only 86 deals were completed in 2002, one-tenth the record level of 871 IPOs in 1996. The IPO market shows no sign of improvement in 2003, with only 38 deals totaling $4.9 billion currently in the works. Merger and Acquisition activity also declined in 2002. The value of M&A activity of U.S. target companies fell to an eight year low of $458 billion, down 41 percent from 2001, and 74 percent down from the record levels of 2000. |
|
|
| Forecasts of the New York State Economy | ||||||
|
State Fiscal Year (annual percent changes, unless otherwise noted) |
||||||
| State Fiscal Year ending in: | ||||||
| 2001 | 2002 | 2003* | 2004* | 2005* | 2006* | |
|
|
||||||
| Real Gross State Product | 6.4 | 0.6 | 2.8 | 2.6 | 3.8 | 3.7 |
| Personal Income | 8.1 | 0.9 | 1.3 | 2.7 | 4.4 | 4.5 |
| Wages and Salaries | 9.8 | (1.0) | 1.0 | 2.9 | 5.3 | 5.0 |
| Nonagricultural Employment | 1.9 | (0.7) | (0.8) | 0.0 | 1.2 | 1.1 |
| Unemployment Rate | 4.5 | 5.3 | 6.0 | 6.2 | 5.8 | 5.6 |
| Average Wage | 7.7 | (0.3) | 1.7 | 2.9 | 4.1 | 3.8 |
| Source: Economy.com and *Ways and Means - Minority Forecast | ||||||
|
|
|
|||||||||||||||
|
|||||||||||||||
| (thousands of jobs) | |||||||||||||||
|
Change: 2001-2002 |
|||||||||||||||
| 1998 | 1999 | 2000 | 2001 | 2002 | Amount | Percent | |||||||||
|
|
|||||||||||||||
| Total Nonagricultural | 8,235.1 | 8,454.9 | 8,636.6 | 8,634.9 | 8,542.2 | (92.7) | (1.1%) | ||||||||
| Mining | 4.5 | 4.5 | 4.6 | 4.7 | 4.9 | 0.2 | 3.4% | ||||||||
| Construction | 283.5 | 310.6 | 328.2 | 333.5 | 336.9 | 3.4 | 1.0% | ||||||||
| Manufacturing | 911.7 | 891.2 | 877.9 | 842.4 | 797.2 | (45.2) | (5.7%) | ||||||||
| Total Trade | 1,662.1 | 1,708.5 | 1,742.4 | 1,734.3 | 1,718.7 | (15.6) | (0.9%) | ||||||||
| Wholesale Trade | 1,662.1 | 1,708.5 | 1,742.4 | 1,734.3 | 1,718.7 | (15.6) | (0.9%) | ||||||||
| Wholesale Trade | 436.6 | 444.6 | 445.2 | 431.5 | 422.1 | (9.4) | (2.2%) | ||||||||
| Retail Trade | 1,225.5 | 1,263.9 | 1,297.2 | 1,302.8 | 1,296.6 | (6.2) | (0.5%) | ||||||||
| Transportation & Public Utilities | 412.7 | 421.1 | 432.3 | 436.3 | 422.6 | (13.7) | (3.2%) | ||||||||
| Transportation | 250.0 | 257.2 | 263.6 | 259.4 | 249.1 | (10.3) | (4.2%) | ||||||||
| Finance | 735.5 | 744.7 | 747.0 | 740.9 | 716.8 | (24.1) | (3.4%) | ||||||||
| Services | 2,801.0 | 2,928.5 | 3,036.3 | 3,068.2 | 3,060.0 | (8.1) | (0.3%) | ||||||||
| Misc. Business Services | 537.0 | 574.7 | 620.4 | 598.0 | 567.0 | (30.9) | (5.5%) | ||||||||
| Health Services | 753.1 | 765.8 | 769.2 | 779.5 | 797.5 | 18.0 | 2.3% | ||||||||
| Legal Services | 110.8 | 115.8 | 117.4 | 118.6 | 118.1 | (0.5) | (0.5%) | ||||||||
| Engineering & Management Services | 209.7 | 222.6 | 238.9 | 243.3 | 235.5 | (7.8) | (3.3%) | ||||||||
| Government | 1,424.1 | 1,445.8 | 1,467.8 | 1,474.6 | 1,485.2 | 10.6 | 0.7% | ||||||||
| Private Sector | 6,810.9 | 7,009.2 | 7,168.7 | 7,160.3 | 7,057.0 | (103.3) | (1.5%) | ||||||||
| Source: Economy.com | |||||||||||||||
|
|
| December to December Change in Non-Agricultural Employment Change | ||||||||
| December Non-Agricultural Employment (Thousands) |
Change: 2001-2002 |
|||||||
| 1997 | 1998 | 1999 | 2000 | 2001 | 2002 | Amount | Percent | |
|
|
||||||||
| NEW YORK STATE | 8,277.3 | 8,442.8 | 8,671.4 | 8,831.3 | 8,679.0 | 8,634.2 | (44.8) | (0.5%) |
| METROPOLITAN AREAS | ||||||||
| NEW YORK PMSA (8 COS.) | 4,073.8 | 4,165.6 | 4,283.2 | 4,389.3 | 4,256.0 | 4,210.9 | (45.1) | (1.1%) |
| NEW YORK CITY | 3,545.6 | 3,630.3 | 3,730.8 | 3,821.4 | 3,689.0 | 3,645.6 | (43.4) | (1.2%) |
| PUTNAM | 21.2 | 22.0 | 23.1 | 23.5 | 23.8 | 24.0 | 0.2 | 0.8% |
| ROCKLAND | 103.8 | 108.4 | 109.9 | 113.5 | 113.1 | 113.0 | (0.1) | (0.1%) |
| WESTCHESTER | 403.2 | 404.8 | 420.4 | 431.0 | 429.8 | 428.4 | (1.4) | (0.3%) |
| ALBANY-SCHENECTADY-TROY | 441.9 | 449.2 | 458.5 | 468.3 | 467.4 | 469.0 | 1.6 | 0.3% |
| BINGHAMTON | 116.6 | 116.9 | 119.7 | 121.1 | 118.0 | 115.2 | (2.8) | (2.4%) |
| BUFFALO-NIAGARA FALLS | 554.1 | 556.0 | 564.4 | 564.8 | 560.9 | 558.7 | (2.2) | (0.4%) |
| DUTCHESS COUNTY | 109.7 | 111.7 | 116.8 | 119.7 | 119.1 | 119.2 | 0.1 | 0.1% |
| ELMIRA | 44.3 | 44.9 | 44.4 | 44.5 | 43.7 | 42.6 | (1.1) | (2.6%) |
| GLENS FALLS | 48.1 | 48.9 | 50.0 | 50.0 | 49.9 | 49.2 | (0.7) | (1.4%) |
| JAMESTOWN | 58.8 | 58.5 | 59.8 | 59.7 | 58.8 | 58.6 | (0.2) | (0.3%) |
| NASSAU-SUFFOLK | 1,155.8 | 1,184.4 | 1,225.5 | 1,253.9 | 1,253.7 | 1,250.0 | (3.7) | (0.3%) |
| NEWBURGH NY-PA | 124.0 | 127.0 | 132.5 | 135.1 | 134.8 | 135.0 | 0.2 | 0.1% |
| ROCHESTER | 542.0 | 550.0 | 556.4 | 559.5 | 552.4 | 545.7 | (6.7) | (1.2%) |
| SYRACUSE | 342.1 | 347.5 | 353.3 | 356.2 | 355.4 | 354.3 | (1.1) | (0.3%) |
| UTICA-ROME | 128.9 | 132.8 | 135.6 | 137.4 | 136.1 | 135.3 | (0.8) | (0.6%) |
| NON-METROPOLITAN AREAS | ||||||||
| ALLEGANY | 16.4 | 17.1 | 17.3 | 17.6 | 17.5 | 17.7 | 0.2 | 1.1% |
| CATTARAUGUS | 34.2 | 34.5 | 35.4 | 35.1 | 35.3 | 35.2 | (0.1) | (0.3%) |
| CHENANGO | 16.5 | 16.9 | 17.3 | 17.7 | 17.7 | 17.6 | (0.1) | (0.6%) |
| CLINTON | 34.2 | 34.5 | 35.6 | 36.3 | 36.6 | 36.6 | - | 0.0% |
| COLUMBIA | 19.7 | 20.4 | 21.3 | 21.8 | 21.4 | 21.3 | (0.1) | (0.5%) |
| CORTLAND | 19.9 | 19.2 | 19.4 | 20.2 | 20.2 | 20.0 | (0.2) | (1.0%) |
| DELAWARE | 17.2 | 17.2 | 17.5 | 17.4 | 17.5 | 17.5 | - | 0.0% |
| ESSEX | 14.4 | 15.1 | 14.7 | 15.6 | 16.1 | 16.2 | 0.1 | 0.6% |
| FRANKLIN | 16.9 | 17.6 | 18.6 | 18.9 | 19.2 | 19.0 | (0.2) | (1.1%) |
| FULTON | 18.5 | 18.0 | 18.8 | 19.1 | 19.4 | 19.3 | (0.1) | (0.5%) |
| GREENE | 13.2 | 13.4 | 13.9 | 14.4 | 14.4 | 15.3 | 0.9 | 5.9% |
| HAMILTON | 1.6 | 1.7 | 1.7 | 1.7 | 1.8 | 1.8 | - | 0.0% |
| JEFFERSON | 38.6 | 38.4 | 39.4 | 39.7 | 39.5 | 39.5 | - | 0.0% |
| LEWIS | 6.9 | 6.6 | 6.7 | 6.7 | 6.6 | 6.7 | 0.1 | 1.5% |
| OTSEGO | 23.3 | 24.0 | 24.6 | 25.0 | 25.2 | 25.5 | 0.3 | 1.2% |
| ST. LAWRENCE | 41.4 | 42.5 | 43.3 | 43.3 | 43.1 | 43.5 | 0.4 | 0.9% |
| SCHUYLER | 4.1 | 4.3 | 4.4 | 4.3 | 4.4 | 4.4 | - | 0.0% |
| SENECA | 9.9 | 10.4 | 10.6 | 10.5 | 10.5 | 10.5 | - | 0.0% |
| STEUBEN | 40.3 | 40.5 | 41.7 | 44.6 | 43.4 | 40.6 | (2.8) | (6.9%) |
| SULLIVAN | 22.8 | 23.1 | 24.7 | 24.6 | 24.5 | 24.8 | 0.3 | 1.2% |
| TOMPKINS | 54.9 | 55.9 | 59.1 | 59.9 | 60.4 | 60.6 | 0.2 | 0.3% |
| ULSTER | 59.2 | 61.9 | 64.2 | 65.6 | 65.7 | 65.7 | - | 0.0% |
| WYOMING | 12.4 | 12.5 | 12.9 | 13.1 | 13.1 | 13.2 | 0.1 | 0.8% |
| YATES | 6.1 | 6.1 | 6.4 | 6.5 | 6.7 | 6.8 | 0.1 | 1.5% |
| Source: U.S. Bureau of Labor Statistics and New York State Department of Labor | ||||||||
|
|
| December to December Change in Resident Employment |
| December Resident Employment (Thousands) |
Change 2001-2002 |
December Unemployment Rate |
|||||||
| 1999 | 2000 | 2001 | 2002 | Amount | Percent | 2000 | 2001 | 2002 | |
|
|
|||||||||
| NEW YORK STATE | 8,488.0 | 8,545.0 | 8,326.0 | 8,450.0 | 124.0 | 1.5% | 4.1 | 5.5 | 6.1 |
| METROPOLITAN AREAS | |||||||||
| NEW YORK PMSA (8 COS.) | 3,929.9 | 4,025.1 | 3,869.6 | 3,905.9 | 36.3 | 0.9% | 4.7 | 6.5 | 7.5 |
| NEW YORK CITY | 3,301.9 | 3,397.3 | 3,250.6 | 3,272.6 | 22.0 | 0.7% | 5.1 | 7.1 | 8.2 |
| PUTNAM | 53.0 | 52.5 | 52.5 | 54.2 | 1.7 | 3.1% | 1.9 | 2.7 | 3 |
| ROCKLAND | 140.0 | 140.8 | 138.6 | 141.9 | 3.3 | 2.3% | 2.3 | 3.2 | 3.5 |
| WESTCHESTER | 435.0 | 434.6 | 427.8 | 437.3 | 9.5 | 2.2% | 2.5 | 3.7 | 3.7 |
| ALBANY-SCHENECTADY-TROY | 432.0 | 430.8 | 425.3 | 437.0 | 11.7 | 2.7% | 3 | 3.5 | 3.6 |
| BINGHAMTON | 118.4 | 117.0 | 113.2 | 113.1 | (0.1) | (0.1%) | 3.3 | 5.5 | 6 |
| BUFFALO-NIAGARA FALLS | 535.6 | 523.1 | 513.8 | 524.1 | 10.3 | 2.0% | 4.8 | 5.5 | 5.8 |
| DUTCHESS COUNTY | 116.7 | 116.9 | 115.0 | 117.9 | 2.9 | 2.5% | 2.4 | 3.5 | 3.7 |
| ELMIRA | 41.5 | 40.6 | 39.4 | 39.2 | (0.2) | (0.5%) | 4.1 | 6.5 | 6.3 |
| GLENS FALLS | 54.3 | 53.5 | 52.7 | 53.6 | 0.9 | 1.7% | 4.8 | 6 | 5.7 |
| JAMESTOWN | 62.3 | 61.0 | 59.6 | 60.8 | 1.2 | 2.0% | 4.9 | 6.1 | 6 |
| NASSAU-SUFFOLK | 1,370.5 | 1,366.9 | 1,351.0 | 1,379.4 | 28.4 | 2.1% | 2.5 | 3.7 | 3.9 |
| ORANGE COUNTY | 152.7 | 152.2 | 150.3 | 153.9 | 3.6 | 2.3% | 2.7 | 3.9 | 3.8 |
| ROCHESTER | 542.3 | 533.2 | 521.5 | 527.9 | 6.4 | 1.2% | 3.6 | 5.3 | 5.6 |
| SYRACUSE | 344.2 | 339.1 | 334.9 | 342.1 | 7.2 | 2.1% | 4.3 | 5.3 | 5.3 |
| UTICA-ROME | 135.1 | 133.9 | 131.4 | 133.7 | 2.3 | 1.7% | 4.1 | 4.8 | 5.1 |
| NON-METROPOLITAN AREAS | |||||||||
| ALLEGANY | 21.6 | 21.6 | 21.7 | 22.1 | 0.4 | 1.8% | 6.2 | 5.6 | 6.7 |
| CATTARAUGUS | 38.0 | 37.0 | 37.0 | 37.8 | 0.8 | 2.1% | 6.3 | 7.2 | 6.5 |
| CHENANGO | 22.1 | 22.2 | 22.2 | 22.5 | 0.3 | 1.3% | 4.6 | 6.1 | 5.7 |
| CLINTON | 36.9 | 36.9 | 36.9 | 37.7 | 0.8 | 2.1% | 4.4 | 4.5 | 5 |
| COLUMBIA | 32.4 | 32.5 | 31.6 | 32.3 | 0.7 | 2.2% | 2.6 | 2.8 | 3 |
| CORTLAND | 20.5 | 20.9 | 20.7 | 21.0 | 0.3 | 1.4% | 6.1 | 9.4 | 7.1 |
| DELAWARE | 19.4 | 19.0 | 19.1 | 19.5 | 0.4 | 2.1% | 4.2 | 4.7 | 5.1 |
| ESSEX | 15.5 | 16.1 | 16.4 | 16.9 | 0.5 | 3.0% | 6.4 | 6.6 | 6.4 |
| FRANKLIN | 19.9 | 19.9 | 20.1 | 20.4 | 0.3 | 1.5% | 6.9 | 6.9 | 6.5 |
| FULTON | 24.5 | 24.3 | 24.4 | 24.9 | 0.5 | 2.0% | 5.3 | 5.2 | 5.1 |
| GREENE | 20.2 | 20.5 | 20.3 | 22.0 | 1.7 | 7.7% | 4.6 | 4.7 | 4.3 |
| HAMILTON | 2.2 | 2.1 | 2.1 | 2.2 | 0.1 | 4.5% | 9.2 | 7.3 | 8.1 |
| JEFFERSON | 38.4 | 38.1 | 37.7 | 38.5 | 0.8 | 2.1% | 8.8 | 9.5 | 8.6 |
| LEWIS | 10.8 | 10.8 | 10.7 | 11.0 | 0.3 | 2.7% | 7.8 | 8.7 | 8.2 |
| OTSEGO | 29.1 | 29.0 | 29.0 | 30.0 | 1.0 | 3.3% | 4.7 | 5.1 | 4.6 |
| ST. LAWRENCE | 46.9 | 46.2 | 45.7 | 47.1 | 1.4 | 3.0% | 7.4 | 7.3 | 7.2 |
| SCHUYLER | 7.9 | 7.7 | 7.8 | 7.9 | 0.1 | 1.3% | 6 | 8.8 | 8.7 |
| SENECA | 14.5 | 14.2 | 14.2 | 14.3 | 0.1 | 0.7% | 4.2 | 5.3 | 5.9 |
| STEUBEN | 44.2 | 46.4 | 44.9 | 43.2 | (1.7) | (3.9%) | 4.4 | 7.8 | 8 |
| SULLIVAN | 28.3 | 27.5 | 27.0 | 28.0 | 1.0 | 3.6% | 5.6 | 5.8 | 5.5 |
| TOMPKINS | 49.9 | 49.4 | 49.3 | 50.7 | 1.4 | 2.8% | 2.4 | 3.2 | 3 |
| ULSTER | 78.3 | 78.0 | 77.3 | 79.3 | 2.0 | 2.5% | 2.9 | 3.9 | 3.9 |
| WYOMING | 18.6 | 18.7 | 18.8 | 19.2 | 0.4 | 2.1% | 6.2 | 6.4 | 6.5 |
| YATES | 12.7 | 12.9 | 13.1 | 13.5 | 0.4 | 3.0% | 3.7 | 4.6 | 5.2 |
| Source: New York State Department of Labor | |||||||||
|
|
| IV. Tax Revenue Outlook | ||||||||||||||||||||||||||||||||
|
2002-03 All Funds Collections The Division of the Budget's (DoB) estimate contained in the 2003-04 Executive Budget projects All Funds tax collections in the current fiscal year of $41.04 billion, $29 million above the Committee's projections. The Committee expects a negative $127 million variance will come from lower income tax collections, offset by $58 million from higher sales and compensating use tax collections, $13 million in higher business tax collections, and $28 million in higher other tax revenue.
2003-04 All Funds Collections The Committee is projecting declines of: $1.32 billion (5.5 percent) in Personal Income Tax receipts and $17.1 million (1.4 percent) in other tax receipts. These declines are partially offset by increases of $581.1 million (5.4 percent) in Consumption and Use Taxes and Fees collections and $202.7 million (4.0 percent) in Business Tax receipts. |
||||||||||||||||||||||||||||||||
|
|
| All Funds Tax Receipt Estimates (millions of dollars) | |||||||
| Actual | Estimated | Forecast | |||||
| 1999-00 | 2000-01 | 2001-02 | 2002-03 | 2003-04 | 2004-05 | 2005-06 | |
|
|
|||||||
| Ways & Means - Minority | |||||||
| Personal Income Tax | $21,533 | $26,892 | $27,414 | $23,878 | $22,557 | $24,428 | $25,939 |
| Consumption & Use | 10,615 | 10,670 | 10,542 | 10,845 | 11,426 | 9,029 | 12,050 |
| Business Taxes | 6,134 | 5,846 | 5,185 | 5,049 | 5,251 | 7,869 | 5,852 |
| Other Taxes | 1,448 | 1,200 | 1,173 | 1,237 | 1,220 | 1,675 | 1,289 |
|
|
|||||||
| Total | $39,729 | $44,608 | $44,314 | $41,009 | $40,455 | $43,001 | $45,130 |
| Division of the Budget | 41,038 | 40,933 | 43,012 | 45,414 | |||
|
|
|||||||
| Difference | ($29) | ($478) | ($12) | ($284) | |||
|
|
| General Fund Tax Revenue | |||||||||||||||||||||||||||||||||||||
|
2002-03 General Fund Collections Adjusting for reserves and transfers, the Committee is projecting declines of: $2.95 billion (11.5 percent) in Personal Income Tax receipts; $15.2 million (0.2 percent) in Consumption and Use Taxes and Fees collections; and $162.1 million (4.5 percent) in Business Tax receipts. The Division of the Budget's (DoB) estimate contained in the 2003-04 Executive Budget projects General Fund tax collections in the current fiscal year of $28.36 billion, $61.7 million higher than the Committee's projections. The Committee expects $96.6 million of this variance will come from lower Personal Income Tax collections and $18.1 million from business tax collections. These lower projections are partially offset by $31.1 million from higher sales and use tax collections and $21.9 million in higher other tax revenue. Adjusting for the Revenue Bond Tax Fund transfer, the Committee is projecting General Fund tax collections to be $92.1 billion below the Executive's projections. 2003-04 General Fund Collections
The Committee's projections are $369 million below DoB's estimate contained in the 2003-04 Executive Budget projecting General Fund tax collections in the 2003-04 SFY of $27.22 billion. The Committee expects a negative variance of $377 million from lower income tax collections and $27 million from sales and compensating use tax collections. Adjusting for the Revenue Bond Tax Fund transfer, the Committee is projecting General Fund tax collections to be $494 billion below the Executives projections. Adjusting for reserves and transfers, the Committee is projecting a decrease of $29.7 million (0.1 percent) in Personal Income Tax receipts. The decrease in Personal Income tax collections is offset by increases of $397.5 million (5.6 percent) in Consumption and Use Taxes and Fees collections, and $238.7 million (6.9 percent) in Business Tax receipts. |
|||||||||||||||||||||||||||||||||||||
| General Fund Tax Receipt Estimates (Including Reserves and Transfers, millions of dollars) | |||||||
| 1999-00 | 2000-01 | 2001-02 | 2002-03 | 2003-04 | 2004-05 | 2005-06 | |
|
|
|||||||
| Actual | $33,611 | $29,393 | $37,371 | ||||
| Ways & Means - Minority | $28,293 | $26,846 | $28,660 | $30,109 | |||
| Division of the Budget | 28,355 | 27,215 | 28,660 | 30,203 | |||
|
|
|||||||
| Difference | ($62) | ($369) | $157 | ($94) | |||
| Personal Income Tax | |||||||||||||||||||||||||||||||||||||||||||
Summary
2002-03 Collections Receipts including reserves and transfers are anticipated to decrease by $8.88 billion, or 34.3 percent, to $16.97 billion. The decline in receipts are exaggerate by the use of the $1.2 billion STAR reserve and the use and the transfer of $4.24 billion to the Revenue Bond Tax fund.
2003-04 Collections The use of $1.25 billion from the Refund Reserve Account and the full year impact of the Revenue Bond Tax Fund transfer will result in a decline of $2.10 billion, or 12.3 percent, in total Personal Income Tax receipts including reserves and transfers. STAR payments are expected to increase by $40 million in 2002-03. |
|||||||||||||||||||||||||||||||||||||||||||
| Personal Income Tax Estimates (Including Reserves and Transfers, millions of dollars): | |||||||
| 1999-00 | 2000-01 | 2001-02 | 2002-03 | 2003-04 | 2004-05 | 2005-06 | |
|
|
|||||||
| Actual | $20,339 | $23,566 | $25,854 | ||||
| Ways & Means - Minority | $16,973 | $14,878 | $16,120 | $17,128 | |||
| Division of the Budget | 17,070 | 15,254 | 16,138 | 17,397 | |||
|
|
|||||||
| Difference | ($97) | ($377) | ($18) | ($269) | |||
| Consumption and Use Taxes and Fees | |||||||||||||||||||||||||||||||||||||
Summary
2002-03 Collections
2003-04 Collections |
|||||||||||||||||||||||||||||||||||||
| Consumption and Use Taxes and Fees Estimates (millions of dollars): | |||||||
| 1999-00 | 2000-01 | 2001-02 | 2002-03 | 2003-04 | 2004-05 | 2005-06 | |
|
|
|||||||
| Actual | $7,604 | $7,404 | $7,098 | ||||
| Ways & Means - Minority | $7,083 | $7,481 | $7,730 | $7,933 | |||
| Division of the Budget | 7,052 | 7,508 | 7,788 | 8,034 | |||
|
|
|||||||
| Difference | $31 | ($27) | ($58) | ($101) | |||
| Business Taxes | ||||||||||||||||||||||||||||||||||
Summary
2002-03 Collections
2003-04 Collections |
||||||||||||||||||||||||||||||||||
| Business Tax Collections Estimates (millions of dollars): | |||||||
| 1999-00 | 2000-01 | 2001-02 | 2002-03 | 2003-04 | 2004-05 | 2005-06 | |
|
|
|||||||
| Actual | $4,561 | $4,328 | $3,616 | ||||
| Ways & Means - Minority | $3,454 | $3,693 | $3,984 | $4,203 | |||
| Division of the Budget | 3,472 | 3,682 | 3,787 | 3,922 | |||
|
|
|||||||
| Difference | ($18) | $11 | $197 | $281 | |||
| Other Taxes | ||||||||||||||||||||||||||||||||||
Summary
2002-03 Collections
2003-04 Collections |
||||||||||||||||||||||||||||||||||
| Other Taxes Estimates (millions of dollars): | |||||||
| 1999-00 | 2000-01 | 2001-02 | 2002-03 | 2003-04 | 2004-05 | 2005-06 | |
|
|
|||||||
| Actual | $1,107 | $795 | $803 | ||||
| Ways & Means - Minority | $783 | $795 | $826 | $846 | |||
| Division of the Budget | 761 | 771 | 790 | 850 | |||
|
|
|||||||
| Difference | $22 | $24 | $36 | ($4) | |||
| V. Revenue Actions |
In 1995, Governor Pataki inherited a $5 billion budget gap for the 1995-96 State Fiscal Year. His response to this gap marked a historic shift in the State's fiscal policy. Instead of increasing taxes and raising revenue to close the gap, the 1995-96 State budget cut the size of government and set forth a historic series of tax cuts which highlighted the Governor's first two terms. The 1995-96 State budget marked the realization that the State could not tax its way out of fiscal distress. The tax increases which had occurred during the early 1990's had only compounded the State's troubles. In contrast to the high taxes that drove jobs from the State during the early 90's, the tax reduction during the Pataki administration promoted a stronger business climate, which created jobs and built a larger tax base. A comparison of the growth in tax collections during the last five years of the Cuomo administration and the first five years of the Pataki administration provides a dramatic example of how lowering tax rates can build the overall tax base. During the period between SFYs 1989-90 and 1994-95, while the State was increasing taxes, State tax receipts increased by only $5 billion, from $28.1 billion to $33.1 billion. By comparison, between 1994-95 and 1999-00 tax collections increased by $8.3 billion, a 25.2 percent increase compared to the 15 percent increase during the last five years of the Cuomo administration. Although the increase in growth rates does not seem that great, consider that the growth during the early 1990's relied on tax increases to generate growth while large tax cuts were implemented at the same time collections were increasing during the Pataki administration. By the 1999-00 SFY, the value of tax cuts implemented during the Pataki administration had reached $7.8 billion, an amount equivalent to 23.7 percent of all tax collections in 1994-95. As the State faces new fiscal difficulties in the 2003-04 budget, we must remember the lessons of the 1990's. Increasing taxes may be a quick fix, but in the long run will lead to lower tax collections, job losses, and will cut into the State's tax base. The State can grow out of the current difficulties by maintaining low tax rates, encouraging job growth, and building an even stronger tax base. It is also important to distinguish between the underlying causes of the 1995-96 budget gap and the gap faced this year. In 1995, the State's economy was struggling to create new jobs despite the fact that the U.S. economy was growing strongly. In 1994, U.S. Gross Domestic Product rose by 6.2 percent, while New York's Real Gross State Product increased by only 2.2 percent. New York's business climate and culture of high taxes discouraged economic growth in the State. By 2001, the State's business climate had dramatically improved, largely due to the tax cuts of the later half of the 1990's. New York was poised to continue to operate from a solid financial position when the State was struck with a unique series of events that presented a significant challenge to New York's economy. A prolonged decline in stock prices hurt New York's vital Wall Street at the same time the U.S. economy was slipping into a recession. These factors were exacerbated on September 11, 2001, when a terrorist attack struck the heart of downtown Manhattan. The combination of these events resulted in a significant decline in tax collections, leading to the current budget gaps. Unlike in 1995, New York's overall economy is much stronger now, and is poised to recover on its own. The State, however, must be careful not to harm the economy by placing new burdens on its citizens by increasing taxes. Revenue Summaries
Taxpayer Relief In SFY 2003-04, New Yorker's will save an additional $13.5 billion from these tax cuts, including:
The savings in 2003-04 will bring the total cumulative value of these cuts to $78.2 billion. This value includes $177 million from previously enacted tax cuts that will take effect during the 2003 tax year. These scheduled tax cuts include: Personal Income Taxes $41 million
Earned Income Tax Credit ($15 million)
College Tuition Deduction/Credit ($14 million)
Marriage Penalty Reduction ($11 million)
Alternative Fuel Cell Credit ($1 million) Business Taxes $131 million
Energy Gross Receipts Tax (GRT) Reduction and Reforms ($90 million)
Financial Services Allocations ($30 million)
Green Building Tax Credits ($6 million) Consumption and Use Taxes $5.1 million
Sales Tax on the Transmission and Distribution of Electricity and Gas ($2.8 million)
Beer 1.5 Cent Reduction ($2.3 million)
2003-04 Revenue Actions
National economic conditions, combined with impact of the terrorist attack of September 11th, 2001 have put tremendous pressure on the State's revenue base. As a result, the Governor did not propose a comprehensive tax cut program as part of the 2003-04 Executive Budget. However, the Governor has pledged not to delay any of the previously enacted tax cuts. The Budget did propose a variety of measures that impact the State's revenues. The following section summarizes the proposed changes to taxes and other revenue streams made as part of the 2003-04 Executive Budget proposal. Sales and Use Tax
Exemption On Clothing Business Taxes
Insurance Tax Reform Under the current tax structure, an insurance company must calculate its tax liability under several different bases, and then pay the tax based on the highest calculated tax liability. These bases include entire net income, entire net income plus compensation of certain officers, allocated capital, and a minimum tax of $250. Additional taxes are imposed on gross premiums and on subsidiary capital.
Bank Tax Reform Permanent Extension
Bank Tax Glass-Steagall Extender
Venture Capital Tax Credit The credit for the fourth program is equal to 50 percent of the total investment. However, the maximum credit that can be taken per year is 10 percent (10 percent over 10 years). The maximum amount of the total capital eligible for the credit is capped at $250 million. The first year that the credit can be claimed is 2005. However, insurance companies may start investing immediately.
Increase of Limited Liability Company Fees
SUV Expensing Personal Income Tax
Historical Homes Rehabilitation Tax Credit
Institution of Withholding Tax for Non-Resident Partnerships Tobacco Securitization
Tobacco Settlement Financing Corporation Act Prior to entering into a sales agreement, the Director of the Division of the Budget must provide written notification to the Chairmen of the Senate Finance Committee and the Assembly Ways and Means Committee of any plan to sell tobacco settlement payments, and must also describe how the sales, combined with other recurring budget reductions and other ongoing or anticipated actions, supports a multi-year plan to achieve a balanced budget. The proceeds of the sale of the tobacco settlement payments by the State would be required to be used for:
As part of the 2003-04 Executive Budget, the State Financial Plan anticipates the use of $1.5 billion in 2002-03, $2.3 billion in 2003-04 and $400 million in 2004-05 from the sale of tobacco settlement payments to help close the budget gaps in these years. |
|
Lottery |
|
Video Lottery Terminals |
| VLT Distribution | ||
|
Purse Enhancement
|
||
| Years | Original | 2003-04 Proposal |
|
|
||
| 1 | 35% | 0% |
| 2 | 45% | 0% |
| 3 - 5 | 45% | 10% |
| 6 - 9 | N/A | 15% |
| 10 + | N/A | 20% |
Breeders Fund
|
||
Years |
Original |
2003-04 Proposal |
| 1 - 2 | 5% | 0% |
| 3 - 5 | 5% | 2.5% |
| 6 - 9 | N/A | 2.5% |
| 10 + | N/A | 5% |
| Fee and Revenue Actions |
| Agency* | Fee Description Effective Date |
Fund Typeand Category |
Current Fee |
Proposed Fee |
Year of Last Change |
New Annual Revenue SFY2003-04 |
New Full Annual Revenue |
|
|
|||||||
| (000) | (000) | ||||||
I. ADMINISTRATIVE |
|||||||
| ABC | Increase penal bonds-10/1/03 | GFMR | $1,000 | $2,500 | 1967 | $500 | $1,000 |
| CPB | Increase the Do Not Call registry fee - 2/1/04 | SFMR | $800 | TBD** during rule making | 2002 | $0 | $700 |
| DCJS | Increase the Unified Court System's data processing fee for criminal history searches - 10/1/03 | SFMR | $16 | $43 | 1991 | $9,450 | $18,900 |
| DEC | Increase current user fees - 4/1/03 | SFMR | Various | Various | 1994 | $500 | $500 |
| DMV | Increase photo ID fee - 4/1/03 | SFMR | $3 | $5 | 1997 | $10,000 | $10,000 |
| HESC | Increase administrative fee for College Choice Tuition Savings Program - 4/1/03 | SFMR | 0.60% | 0.65% | 2002 | $718 | $718 |
| Ins | Impose assessment to offset costs of disaster preparedness unit - 4/1/03 | SFMR | Assessment finances Ins. Dept's costs | Increase assessment to finance new costs | NA | $2,081 | $3,000 |
| Ins | Impose assessment to offset costs of fraud proof prescription program - 4/1/03 | SFMR | Assessment finances Ins. Dept's costs | Increase assessment to finance new costs | NA | $10,000 | $10,000 |
| Ins | Impose assessment to offset costs of immunization program - 4/1/03 | SFMR | Assessment finances Ins. Dept's costs | Increase assessment to finance new costs | NA | $8,000 | $8,000 |
| Ins | Impose assessment to offset costs of newborn screening - 4/1/03 | SFMR | Assessment finances Ins. Dept's costs | Increase assessment to finance new costs | NA | $6,000 | $6,000 |
| Ins | Impose assessment to offset costs of Center for Community Health screening and wellness programs - 4/1/03 | SFMR | Assessment finances Ins. Dept's costs | Increase assessment to finance new costs | NA | $10,000 | $10,000 |
| Parks | Increase current user fees at 130 State facilities - 4/1/03 | SFMR | Various | Various | 1994 | $2,500 | $2,500 |
| Administrative Actions Subtotals |
$59,749
|
$71,318
|
|||||
II. STATUTORY |
|||||||
| Ag&Mkts | Establish new biennial fee on unregistered/unlicensed retail stores, food ware-houses, feed mills - 4/1/03 | SFMR | None | $200 for food warehouses; $100 for other | New | $342 | $342 |
| Ag&Mkts | Establish new annual fee for certificates of free sale - 4/1/03 | SFMR | None | $25 per certificate | New | $65 | $65 |
| Ag&Mkts | Increase biennial fees for slaughterhouses, refrigerated warehouses, food salvage facilities - 4/1/03 | SFMR | $20-$100 | $200 | 1988 | $19 | $19 |
| Ag&Mkts | Increase biennial fees for Nursery Dealers and Nursery Growers - 4/1/03 | SFMR | $20-$40 | $100 | 1992 | $254 | $254 |
| CVB | Increase Crime Victims Assistance fee - 10/1/03 | SFMR | $10 | $20 | 2000 | $780 | $1,560 |
| CVB | Impose Crime Victims Assistance fee on V&T offenses - 10/1/03 | SFMR | None | $5 | New | $4,045 | $8,090 |
| CVB | Increase mandatory surcharges on penal law convictions by 25%-50% - 10/1/03 | SFMR |
$200/$110/ $50 |
$250/$140/ $75 |
2000 | $1,950 | $3,900 |
| CVB | Increase mandatory surcharges on V&T convictions by 25%-50% - 10/1/03 | SFMR |
$200/$110/ $30/$20 |
$250/$140/ $45/$25 |
2000 | $1,525 | $3,050 |
| DCJS | Increase mandatory surcharges on V&T felonies, misdemeanors, violations, & equipment - 10/1/03 | SFMR |
Felonies: $200 Misdemean: $110 Violations: $30 Equipment: $20 |
Felonies: $250 Misdemean: $140 Violations: $45 Equipment: $25 |
2000 | $11,850 | $23,700 |
| DCJS | Increase attorney registration biennial fee - 10/1/03 | SFMR | $300 | $350 | 1991 | $2,000 | $4,000 |
| DCJS | Impose $35 surcharge on driver's license reinstatement - 10/1/03 | SFMR | None | $35 | New | $8,950 | $17,900 |
| DCJS | Require holders of HAZMAT license endorsement to undergo criminal background check - 4/1/03 | GFMR | None | $75 | New | $2,000 | $2,000 |
| DCJS | Require sex offenders to pay a DNA databank fee, a sex offender registration fee, and a sex offender registration change fee - 4/1/03 | GFMR | None |
$50/$50/ $10 |
New | $800 | $800 |
| DCJS | Raise fingerprinting fee - 4/1/03 | SFMR | $50 | $75 | 1996 | $9,900 | $9,900 |
| DEC | Impose fee on new tire sales - 10/1/03 | GFMR | None | $2.25 per tire sold | N/A | $22,500 | $45,000 |
| DEC | Increase Oil and Gas Depth fees - 4/1/03 | GFMR | Varies by depth | Double | 1987 | $200 | $200 |
| DEC | Increase by 25% fee charged per industrial facility permitted to discharge pollutants into NYS waters - 4/1/03 | SFMR | $375 to $37,500 | $475 to $47,000 | 1989 | $1,000 | $1,000 |
| DEC | Increase by 25% fee charged per power plant permitted to discharge pollutants into NYS waters - 4/1/03 | SFMR | $40,000 | $50,000 | 1989 | $500 | $500 |
| DEC | Increase fees for mining permits - 4/1/03 | SFMR | $1,200 to $2,000 per acre | $1,500 to $4,000 per acre | 1991 | $750 | $750 |
| DMNA | Increase annual fee paid by nuclear generating facility operators - 4/1/03 | SFMR | $550,000 for each reactor | $950,000 for each reactor | 1994 | $2,400 | $2,400 |
| DMV | Increase certificate of vehicle sale fee - 10/1/03 |
GFTX/ CFMR |
$1 | $5 | 1993 | $6,000 | $12,000 |
| DMV | Increase data search fee by $1 - 10/1/03 |
GFMR/ CFMR |
$5 manual $4 electronic |
$6 manual $5 electronic |
1991 | $5,500 | $11,000 |
| DMV | Increase original title application fee - 10/1/03 |
GFTX/ CFMR |
$5 | $10 | 1989 | $7,338 | $14,675 |
| DMV | Increase emissions sticker fee - 10/103 | SFMR | $2 | $4 | 1993 | $8,000 | $16,000 |
| DOB | Increase cost recovery assessments' cap- 4/1/03 |
GFMR/ SFMR |
$20 million | $40 million | 1989 | $15,000 | $15,000 |
| DOCS | Increase charge for license plates - 4/1/03 | GFTX | $5.50 | $15 | 1992 | $21,700 | $21,700 |
| DOH-Medical Asst | Reestablish a temporary .7% nonreimbursable assessment on hospital revenues - 4/1/03 | SFMR | None | .7% of gross revenues | Phased-out in 1999 | $190,200 | Reduce by 25% each year and phase-out by 2007 |
| DOH-Medical Asst | Reestablish a temporary .6% assessment on home care services revenues - 4/1/03 | SFMR | None | .6% of gross revenues | Phased-out in 1999 | $17,000 | Reduce by 25% each year and phase-out by 2007 |
| DOH - Other | Increase vital records fee - 4/1/03 | SFMR | $15 | $30 | 1989 | $1,680 | $2,388 |
| DOH - Other | Increase EPIC rates and deductibles by 10% - 4/1/03 | SFMR | Various | Various | 2001 | $1,500 | $1,500 |
| DOH - Other | Increase covered lives assessment in HCRA - 1/1/04 | Non-State Fund | $690 million | $725 million | 2002 | $35,000 | $35,000 |
| DOH - Other | Increase HCRA surcharges - 7/1/03 | Non-State Fund |
$8.18 Private payors $5.98 Medicaid payors |
$8.85 Private payors $6.47 Medicaid payors |
1996 | $20,000 | $80,000 |
| DOT | Increase heavyweight "killer truck" fine schedule by average of $500 - 10/1/03 | GFMR | Various | Average increase of $500 | 1985 | $1,500 | $3,000 |
| DOT | Revise and expand the heavyweight truck permit program - 10/1/03 | CFMR | Varies | No increase in fees, but increase in number of statutory permits allowed | NA | $750 | $1,500 |
| DSP | Raise vehicle insurance fee - 4/1/03 | SFMR | $1 | $5 | 1992 | $42,700 | $51,300 |
| Judiciary | Increase parking surcharges - 10/1/03 | GFMR | $5 | $15 | 1991 | $16,000 | $32,000 |
| Judiciary | Impose an Appellate Court motion fee - 10/1/03 | GFMR | None | $35 | New | $630 | $1,260 |
| Judiciary | Increase all civil courts fee by 25% - 10/1/03 | GFMR | Various | Various | 1990 | $18,150 | $36,300 |
| Judiciary | Impose a $25 surcharge on DWI or DWAI convictions - 10/1/03 | GFMR | None | $25 | New | $500 | $1,000 |
| Judiciary | Impose a $35 motion fee on Supreme/County courts - 10/1/03 | GFMR | None | $35 | New | $4,200 | $8,400 |
| Law | Increase fee for broker/dealer statements - 4/1/03 | SFMR | $20 to $800 | $30 to $1,200 | 1989 | $2,000 | $2,000 |
| Law | Increase fee for real estate syndication offerings - 4/1/03 | SFMR | $500 to $20,000 | $750 to $20,000 | 1989 | $1,000 | $1,000 |
| ORPS | Increase the fee on real property transfers - 4/1/03 | SFMR | $25 | $50 | 1991 | $9,600 | $9,600 |
| OSC | Increase criminal fines deposited into the Justice Court Fund - 4/1/03 | GFMR | Varies from $100 to $1,500 | Varies from $150 to $2,250 | 1989 | $6,250 | $12,500 |
| OSC | Reduce dormancy period of uncashed checks from three years to one year - 4/1/03 | GFMR | NA | NA | $38,000 | 0; acceleration | |
| Parks | Double boat registration fees - 9/1/03 | GFTX | $9 to $30 per boat | $18 to $60 per boat | 1987 | $1,300 | $2,700 |
| R&W | Assess .5% fee on annual racing handle (total amount wagered) to support regulatory activities - 4/1/03 | SFMR | $0 | .5% of total wagered | New | $16,000 | $16,000 |
| SED | Cap STAR savings for non-seniors at 2002-03 levels - 4/1/03 |
GFTX/ SFTX |
NA | Cap at 2002-03 benefit | 2002 | $93,000 | $0 |
|
TSC Lobbying |
Double annual lobbyist registration fees - 4/1/03 | GFMR | $50 |
$100-2004 $200-2005 biennially thereafter |
1983 | $200 | $200 |
| Statutory Actions - Subtotal |
$652,528
|
$513,453
|
|||||
| ADMINISTRATIVE AND STATUTORY - GRAND TOTAL |
$712,277
|
$584,771
|
|||||
III. OTHER REVENUE ACTIONS |
|||||||
| Labor | Impose interest assessment on employer unemployment insurance taxes - 4/1/03 | SFTX | None | Varies: Average of $1.80 per employee | NA | $22,000 | TBD** |
| T&F | Replace current clothing sales tax exemption with four one-week exempt periods - 6/1/03 |
GFTX/ DFTX |
Clothing items costing less than $110 are exempt all year | Clothing items costing less than $500 would be exempt for four one-week periods | 2000 | $363,400 | $418,900 |
| T&F | Eliminate the income base and other nonpremium bases other than the fixed dollar minimum; raise the premiums' tax base to 2% of premiums - 1/1/03 |
GFTX/ SFTX |
Percent of premiums: Life & Health 0.7% Accident & Health 1.0% Property & Casualty 1.3% |
Percent of premiums: 2% all insurers | 1999 | $158,000 | $160,000 |
| T&F | Increase limited liability company filing fee - 1/1/03 |
GFTX/ DFTX |
$50 per partner | $100 per partner | 1995 | $25,000 | $25,000 |
| T&F | Initiate withholding for nonresident partnership - 7/1/03 |
GFTX/ DFTX |
No withholding | Implement withholding | NA | $15,000 | $25,000 |
| T&F | Decouple from Federal expensing for certain SUV's - 1/1/04 |
GFTX/ DFTX |
Expense full amount in first year | Use regular depreciation | NA | $0 | $2,000 |
| Other Revenue Actions - Subtotal |
$583,400
|
$630,900
|
|||||
ALL FEE AND REVENUE ACTIONS - GRAND TOTAL |
$1,295,677 |
$1,215,671 |
|||||
Key: CF = Capital Projects Fund DF = Debt Service Funds GF = General Fund MR = Miscellaneous Receipts SF = Special Revenue Funds TX = Tax * Key to Agency abbreviations in Appendix I **TBD - To be determined Source: NYS Division of the Budget |
|||||||
| VI. Revenue Tables |
| Minority Ways & Means All Funds Tax Forcast |
|
(millions of dollars) |
Actual |
Estimated |
Difference: |
||
| 2001-02 | 2002-03 | Amount | Percent | |
|
|
||||
| Personal Income Tax: | ||||
| Withholding | $20,261.3 | $19,978.1 | ($283.2) | (1.4%) |
| Estimated Payments | 6,352.9 | 4,868.3 | (1,484.6) | (23.4%) |
| Final Returns | 1,874.3 | 1,339.0 | (535.3) | (28.6%) |
| Other Payments | 601.1 | 797.7 | 196.6 | 32.7% |
|
|
||||
| Gross Receipts | $29,089.6 | $26,983.1 | ($2,106.50) | (7.2%) |
| Less Refunds Issued | (3,515.9) | (4,355.1) | (839.2) | 23.9% |
| Refund Reserve Reduction (Increase) | 1,840.0 | 1,250.0 | (590.0) | (32.1%) |
|
|
||||
| Total | $27,413.7 | $23,878.0 | ($3,535.7) | (12.9%) |
Consumption and Use Taxes and Fees: |
||||
| Sales and Use | $8,539.7 | $8,821.4 | $281.7 | 3.3% |
| Cigarette and Tobacco | 531.7 | 464.0 | (67.7) | (12.7%) |
| Motor Fuel | 489.4 | 537.9 | 48.5 | 9.9% |
| Motor Vehicle | 583.4 | 613.4 | 30.0 | 5.1% |
| Highway Use | 148.3 | 147.7 | (0.6) | (0.4%) |
| Alcoholic Beverage | 178.2 | 180.8 | 2.6 | 1.5% |
| Alcoholic Beverage Control License | 34.2 | 39.9 | 5.7 | 16.7% |
| Auto Rental | 37.9 | 40.2 | 2.3 | 6.1% |
|
|
||||
| Total | $10,542.8 | $10,845.3 | $302.5 | 2.9% |
Business Taxes: |
||||
| Corporation Franchise Tax | $1,702.5 | $1,668.3 | ($34.2) | (2.0%) |
| Corporation and Utilities | 1,217.9 | 1,082.3 | (135.6) | (11.1%) |
| Insurance | 696.3 | 728.6 | 32.3 | 4.6% |
| Bank | 565.6 | 506.9 | (58.7) | (10.4%) |
| Petroleum Business Tax | 1,002.5 | 1,062.5 | 60.0 | 6.0% |
|
|
||||
| Total | $5,184.8 | $5,048.6 | ($136.2) | (2.6%) |
Other Taxes: |
||||
| Estate and Gift | $767.7 | $748.2 | ($19.5) | (2.5%) |
| Real Property Gains | 4.7 | 3.9 | (0.8) | (17.0%) |
| Real Estate Transfer Tax | 370.6 | 454.4 | 83.8 | 22.6% |
| Pari-Mutuel | 29.6 | 30.0 | 0.4 | 1.4% |
| Other | 0.7 | 0.6 | (0.1) | (14.3%) |
|
|
||||
| Total | $1,173.3 | $1,237.1 | $63.8 | 5.4% |
|
|
||||
| Total Tax Receipts | $44,314.6 | $41,009.0 | ($3,305.6) | (7.5%) |
Source: Minority Ways & Means Committee. |
||||
| Minority Ways & Means All Funds Tax Forcast |
|
(millions of dollars) |
Actual |
Estimated |
Difference: |
||
| 2002-03 | 2003-04 | Amount | Percent | |
|
|
||||
| Personal Income Tax: | ||||
| Withholding | $19,978.1 | $20,694.9 | $716.8 | 3.6% |
| Estimated Payments | 4,868.3 | 4,522.3 | (346.0) | (7.1%) |
| Final Returns | 1,339.0 | 1,106.1 | (232.9) | (17.4%) |
| Other Payments | 797.7 | 697.1 | (100.6) | (12.6%) |
|
|
||||
| Gross Receipts | $26,983.1 | $27,020.4 | $37.3 | 0.1% |
| Less Refunds Issued | (4,355.1) | (4,422.1) | (67.0) | 1.5% |
| Refund Reserve Reduction (Increase) | 1,250.0 | (41.0) | (1,291.0) | (103.3%) |
|
|
||||
| Total | $23,878.0 | $22,557.3 | ($1,320.7) | (5.5%) |
Consumption and Use Taxes and Fees: |
||||
| Sales and Use | $8,821.4 | $9,388.7 | $567.3 | 6.4% |
| Cigarette and Tobacco | 464.0 | 442.6 | (21.4) | (4.6%) |
| Motor Fuel | 537.9 | 534.8 | (3.1) | (0.6%) |
| Motor Vehicle | 613.4 | 648.0 | 34.6 | 5.6% |
| Highway Use | 147.7 | 148.6 | 0.9 | 0.6% |
| Alcoholic Beverage | 180.8 | 179.8 | (1.0) | (0.6%) |
| Alcoholic Beverage Control License | 39.9 | 42.6 | 2.7 | 6.8% |
| Auto Rental | 40.2 | 41.3 | 1.1 | 2.7% |
|
|
||||
| Total | $10,845.3 | $11,426.4 | $581.1 | 5.4% |
Business Taxes: |
||||
| Corporation Franchise Tax | $1,668.3 | $1,713.0 | $44.7 | 2.7% |
| Corporation and Utilities | 1,082.3 | 1,022.7 | (59.6) | (5.5%) |
| Insurance | 728.6 | 937.2 | 208.6 | 28.6% |
| Bank | 506.9 | 562.4 | 55.5 | 10.9% |
| Petroleum Business Tax | 1,062.5 | 1,016.0 | (46.5) | (4.4%) |
|
|
||||
| Total | $5,048.6 | $5,251.3 | $202.7 | 4.0% |
Other Taxes: |
||||
| Estate and Gift | $748.2 | $760.0 | $11.8 | 1.6% |
| Real Property Gains | 3.9 | 2.3 | (1.6) | (41.0%) |
| Real Estate Transfer Tax | 454.4 | 425.0 | (29.4) | (6.5%) |
| Pari-Mutuel | 30.0 | 32.0 | 2.0 | 6.7% |
| Other | 0.6 | 0.7 | 0.1 | 16.7% |
|
|
||||
| Total | $1,237.1 | $1,220.0 | ($17.1) | (1.4%) |
|
|
||||
| Total Tax Receipts | $41,009.0 | $40,455.0 | ($554.0) | (1.4%) |
Source: Minority Ways & Means Committee. |
||||
| Minority Ways & Means General Funds Tax Forcast |
|
(millions of dollars) |
Actual |
Estimated |
Difference: |
||
| 2001-02 | 2002-03 | Amount | Percent | |
|
|
||||
| Personal Income Tax: | ||||
| Withholding | $20,261.3 | $19,978.1 | ($283.2) | (1.4%) |
| Estimated Payments | 6,352.9 | 4,868.3 | (1,484.6) | (23.4%) |
| Final Returns | 1,874.3 | 1,339.0 | (535.3) | (28.6%) |
| Other Payments | 601.1 | 797.7 | 196.6 | 32.7% |
| Gross Receipts | $29,089.6 | $26,983.1 | ($2,106.5) | (7.2%) |
| Less Refunds Issued | (3,515.9) | (4,355.1) | (839.2) | 23.9% |
| STAR Deposit | (2,510.1) | (2,667.0) | (156.9) | NA |
| STAR Reserves | 1,200.0 | 0.0 | (1,200.0) | NA |
| Revenue Bond Fund/DRRF | (250.0) | (4,237.6) | (3,987.6) | NA |
| Refund Reserve Reduction (Increase) | 1,840.0 | 1,250.0 | (590.0) | NA |
|
|
||||
| Total | $25,853.6 | $16,973.4 | ($8,880.2) | (34.3%) |
Consumption and Use Taxes and Fees: |
||||
| Sales and Use | $6,131.3 | $6,323.1 | $191.8 | 3.1% |
| Cigarette and Tobacco | 531.7 | 464.0 | (67.7) | (12.7%) |
| Motor Vehicle | 185.0 | 75.3 | (109.7) | (59.3%) |
| Alcoholic Beverage | 178.2 | 180.8 | 2.6 | 1.5% |
| Alcoholic Beverage Control License | 34.2 | 39.9 | 5.7 | 16.7% |
| Auto Rental | 37.9 | (37.9) | (100.0%) | |
|
|
||||
| Total | $7,098.3 | $7,083.1 | ($15.2) | (0.2%) |
Business Taxes: |
||||
| Corporation Franchise Tax | $1,514.9 | $1,478.4 | ($36.5) | (2.4%) |
| Corporation and Utilities | 972.2 | 875.2 | (97.0) | (10.0%) |
| Insurance | 633.1 | 662.6 | 29.5 | 4.7% |
| Bank | 495.8 | 437.7 | (58.1) | (11.7%) |
| Petroleum Business Tax | 0.1 | - | (0.1) | (100.0%) |
|
|
||||
| Total | $3,616.0 | $3,453.9 | ($162.1) | (4.5%) |
Other Taxes: |
||||
| Estate and Gift | $767.7 | $748.2 | ($19.5) | (2.5%) |
| Real Property Gains | 4.7 | 3.9 | (0.8) | (17.0%) |
| Pari-Mutuel | 29.6 | 30.0 | 0.4 | 1.4% |
| Other | 0.7 | 0.6 | (0.1) | (14.3%) |
|
|
||||
| Total | $802.7 | $782.7 | ($20.0) | (2.5%) |
|
|
||||
| Total Tax Receipts | $37,370.6 | $28,293.1 | ($9,077.5) | "right" valign="top"> (24.3%) |
Source: Minority Ways & Means Committee. |
||||
| Minority Ways & Means General Funds Tax Forcast |
|
(millions of dollars) |
Actual |
Estimated |
Difference: |
||
| 2002-03 | 2003-04 | Amount | Percent | |
|
|
||||
| Personal Income Tax: | ||||
| Withholding | $19,978.1 | $20,694.9 | $716.8 | 3.6% |
| Estimated Payments | 4,868.3 | 4,522.3 | (346.0) | (7.1%) |
| Final Returns | 1,339.0 | 1,106.1 | (232.9) | (17.4%) |
| Other Payments | 797.7 | 697.1 | (100.6) | (12.6%) |
| Gross Receipts | $26,983.1 | $27,020.4 | $37.3 | 0.1% |
| Less Refunds Issued | (4,355.1) | (4,422.1) | (67.0) | 1.5% |
| STAR Deposit | (2,667.0) | (2,707.0) | (40.0) | NA |
| Revenue Bond Fund | (4,237.6) | (4,972.8) | (735.2) | NA |
| Refund Reserve Reduction (Increase) | 1,250.0 | (41.0) | (1,291.0) | NA |
|
|
||||
| Total | $16,973.4 | $14,877.5 | ($2,095.9) | (12.3%) |
Consumption and Use Taxes and Fees: |
||||
| Sales and Use | $6,323.1 | $6,741.3 | $418.2 | 6.6% |
| Cigarette and Tobacco | 464.0 | 442.6 | (21.4) | (4.6%) |
| Motor Vehicle | 75.3 | 74.3 | (1.0) | (1.3%) |
| Alcoholic Beverage | 180.8 | 179.8 | (1.0) | (0.6%) |
| Alcoholic Beverage Control License | 39.9 | 42.6 | 2.7 | 6.8% |
|
|
||||
| Total | $7,083.1 | $7,480.6 | $397.5 | 5.6% |
Business Taxes: |
||||
| Corporation Franchise Tax | $1,478.4 | $1,518.3 | $39.9 | 2.7% |
| Corporation and Utilities | 875.2 | 832.4 | (42.8) | (4.9%) |
| Insurance | 662.6 | 852.9 | 190.3 | 28.7% |
| Bank | 437.7 | 489.0 | 51.3 | 11.7% |
|
|
||||
| Total | $3,453.9 | $3,692.6 | $238.7 | 6.9% |
Other Taxes: |
||||
| Estate and Gift | $748.2 | $760.0 | $11.8 | 1.6% |
| Real Property Gains | 3.9 | 2.3 | (1.6) | (41.0%) |
| Pari-Mutuel | 30.0 | 32.0 | 2.0 | 6.7% |
| Other | 0.6 | 0.7 | 0.1 | 16.7% |
|
|
||||
| Total | $782.7 | $795.0 | $12.3 | 1.6% |
|
|
||||
| Total Tax Receipts | $28,293.1 | $26,845.7 | ($1,447.4) | (5.1%) |
Source: Minority Ways & Means Committee. |
||||
| Minority Ways & Means All Funds Tax Forcast - SFY 2002-03 |
|
(millions of dollars) |
|
|
General Fund |
Special Revenue Funds |
Capital Project Funds |
Debt Service Funds |
Total All Funds |
|
|
|||||
| Personal Income Tax: | Withholding | $19,978.1 |
|
|
|
$19,978.1 |
| Estimated Payments | 4,868.3 |
|
|
|
4,868.3 |
| Final Returns | 1,339.0 |
|
|
|
1,339.0 |
| Other Payments | 797.7 |
|
|
|
797.7 |
|
|
|||||
| Gross Receipts | $26,983.1 |
|
|
|
$26,983.1 |
| Less Refunds Issued | (4,355.1) |
|
|
|
(4,355.1) |
| Refund Reserve Reduction (Increase) | 1,250.0 |
|
|
|
1,250.0 |
| STAR Deposit | (2,667.0) | 2,667.0 |
|
|
- |
| Revenue Bond Tax Fund | (4,237.6) |
|
|
4,237.6 | - |
|
|
Total | $16,973.4 | $2,667.0 | $0.0 | $4,237.6 | $23,878.0 |
Consumption and Use Taxes and Fees: |
|||||
| Sales and Use | $6,323.1 | $391.4 |
|
$2,106.9 | $8,821.4 |
| Cigarette and Tobacco | 464.0 |
|
|
|
464.0 |
| Motor Fuel |
|
70.0 | 349.1 | 118.8 | 537.9 |
| Motor Vehicle | 75.3 | 77.2 | 460.9 |
|
613.4 |
| Highway Use |
|
|
147.7 |
|
147.7 |
| Alcoholic Beverage | 180.8 |
|
|
|
180.8 |
| Alcoholic Beverage Control License | 39.9 |
|
|
|
39.9 |
| Auto Rental |
|
|
40.2 |
|
40.2 |
|
|
|||||
| Total | $7,083.1 | $538.6 | $997.9 | $2,225.7 | $10,845.3 |
Business Taxes: |
|||||
| Corporation Franchise Tax | $1,478.4 | $189.9 |
|
|
$1,668.3 |
| Corporation and Utilities | 875.2 | 207.1 |
|
|
1,082.3 |
| Insurance | 662.6 | 66.0 |
|
|
728.6 |
| Bank | 437.7 | 69.2 |
|
|
506.9 |
| Petroleum Business Tax |
|
467.5 | 595.0 |
|
1,062.5 |
|
|
|||||
| Total | $3,453.9 | $999.7 | $595.0 | $0.0 | $5,048.6 |
Other Taxes: |
|||||
| Estate and Gift | $748.2 |
|
|
|
$748.2 |
| Real Property Gains | 3.9 |
|
|
|
3.9 |
| Real Estate Transfer Tax |
|
|
112.0 | 342.4 | 454.4 |
| Pari-Mutuel | 30.0 |
|
|
|
30.0 |
| Other | 0.6 |
|
|
|
0.6 |
|
|
|||||
| Total | $782.7 | $0.0 | $112.0 | $342.4 | $1,237.1 |
|
|
|||||
| Total Tax Receipts | $28,293.1 | $4,205.3 | $1,704.9 | $6,805.7 | $41,009.0 |
Source: Minority Ways & Means Committee |
|||||
| Minority Ways & Means All Funds Tax Forcast - SFY 2003-04 |
|
(millions of dollars) |
|
|
General Fund |
Special Revenue Funds |
Capital Project Funds |
Debt Service Funds |
Total All Funds |
|
|
|||||
| Personal Income Tax: | Withholding | $20,694.9 |
|
|
|
$20,694.9 |
| Estimated Payments | 4,522.3 |
|
|
|
4,522.3 |
| Final Returns | 1,106.1 |
|
|
|
1,106.1 |
| Other Payments | 697.1 |
|
|
|
697.1 |
|
|
|||||
| Gross Receipts | $27,020.4 |
|
|
|
$27,020.4 |
| Less Refunds Issued | (4,422.1) |
|
|
|
(4,422.1) |
| Refund Reserve Reduction (Increase) | (41.0) |
|
|
|
(41.0) |
| STAR Deposit | (2,707.0) | 2,707.0 |
|
|
- |
| Revenue Bond Tax Fund | (4,972.8) |
|
|
4,972.8 | - |
|
|
Total | $14,877.5 | $2,707.0 | $0.0 | $4,972.8 | $22,557.3 |
Consumption and Use Taxes and Fees: |
|||||
| Sales and Use | $6,741.3 | $401.4 |
|
$2,246.0 | $9,388.7 |
| Cigarette and Tobacco | 442.6 |
|
|
|
442.6 |
| Motor Fuel |
|
112.3 | 422.5 |
|
534.8 |
| Motor Vehicle | 74.3 | 94.6 | 479.1 |
|
648.0 |
| Highway Use |
|
|
148.6 |
|
148.6 |
| Alcoholic Beverage | 179.8 |
|
|
|
179.8 |
| Alcoholic Beverage Control License | 42.6 |
|
|
|
42.6 |
| Auto Rental |
|
|
41.3 |
|
41.3 |
|
|
|||||
| Total | $7,480.6 | $608.3 | $1,091.5 | $2,246.0 | $11,426.4 |
Business Taxes: |
|||||
| Corporation Franchise Tax | $1,518.3 | $194.7 |
|
|
$1,713.0 |
| Corporation and Utilities | 832.4 | 190.3 |
|
|
1,022.7 |
| Insurance | 852.9 | 84.3 |
|
|
937.2 |
| Bank | 489.0 | 73.4 |
|
|
562.4 |
| Petroleum Business Tax |
|
457.2 | 558.8 |
|
1,016.0 |
|
|
|||||
| Total | $3,692.6 | $999.9 | $558.8 | $0.0 | $5,251.3 |
Other Taxes: |
|||||
| Estate and Gift | $760.0 |
|
|
|
$760.0 |
| Real Property Gains | 2.3 |
|
|
|
2.3 |
| Real Estate Transfer Tax |
|
|
112.0 | 313.0 | 425.0 |
| Pari-Mutuel | 32.0 |
|
|
|
32.0 |
| Other | 0.7 |
|
|
|
0.7 |
|
|
|||||
| Total | $795.0 | $0.0 | $112.0 | $313.0 | $1,220.0 |
|
|
|||||
| Total Tax Receipts | $26,845.7 | $4,315.2 | $1,762.3 | $7,531.8 | $40,455.0 |
Source: Minority Ways & Means Committee |
|||||
| Minority Ways & Means Dedicated Fund Tax Receipts Forecast |
| (millions of dollars) |
|
|
Actual | Estimated | Forecast |
|
|
2001-02 | 2002-03 | 2003-04 |
|
|
|||
| Special Revenue Funds | |||
School Tax Relief Fund (STAR) |
|||
| Personal Income Tax | 1,310.1 | 2,667.0 | 2,707.0 |
Dedicated Mass Transportation Trust Fund |
|||
| Petroleum Business Tax | 325.1 | 340.0 | 330.2 |
| Motor Fuel Tax | 61.8 | 70.0 | 112.3 |
| Motor Vehicle Fees | 27.8 | 77.2 | 94.6 |
|
|
|||
| Total | 414.7 | 487.2 | 537.1 |
Mass Trans. Operating Assistance Fund |
|||
| Corporate Surcharges | |||
| Corporate Franchise Tax | 187.6 | 189.9 | 194.7 |
| Corporation and Utilities Tax | 162.8 | 129.6 | 106.3 |
| Insurance Tax | 63.2 | 66.0 | 84.3 |
| Bank Tax | 69.8 | 69.2 | 73.4 |
| Other | |||
| Sales and Use Tax | 364.7 | 391.4 | 401.4 |
| Petroleum Business Tax | 123.7 | 127.5 | 127.0 |
| Corporation and Utilities - Sec. 183 & 184 | 82.9 | 77.5 | 84.0 |
|
|
|||
| Total | 1,054.7 | 1,051.1 | 1,071.1 |
|
|
|||
| Total Tax Receipts - Special Revenue Funds | 2,779.5 | 4,205.3 | 4,315.2 |
Debt Services Funds |
|||
Debt Reduction Reserve Fund |
|||
| Personal Income Tax | 250.0 | - | - |
Revenue Bond Tax Fund |
|||
| Personal Income Tax | - | 4,237.6 | 4,972.8 |
Emergency Highway Reconditioning and Preservation Fund |
|||
| Motor Fuel Tax | 53.5 | 59.4 | - |
Emergency Highway Construction and Reconstruction Fund |
|||
| Motor Fuel Tax | 53.5 | 59.4 | - |
Clean Water/Clean Air Fund |
|||
| Real Estate Transfer Tax | 258.6 | 342.4 | 313.0 |
Local Government Assistance Tax Fund |
|||
| Sales and Use Tax | 2,043.7 | 2,106.9 | 2,246.0 |
|
|
|||
| Total Tax Receipts - Debt Service Funds | 2,659.3 | 6,805.7 | 7,531.8 |
|
Capital Projects Funds |
|||
|
Dedicated Highway and Bridge Trust Funds |
|||
| Petroleum Business Tax | 553.6 | 595.0 | 558.8 |
| Motor Fuel Tax | 320.6 | 349.1 | 422.5 |
| Motor Vehicle Fees | 370.6 | 460.9 | 479.1 |
| Highway Use Tax | 148.3 | 147.7 | 148.6 |
| Auto Rental Tax | - | 40.2 | 41.3 |
|
|
|||
| Total | 1,393.1 | 1,592.9 | 1,650.3 |
Environmental Protection Fund |
|||
| Real Estate Transfer Tax | 112.0 | 112.0 | 112.0 |
|
|
|||
| Total Tax Receipts - Capital Projects Funds | 1,505.1 | 1,704.9 | 1,762.3 |
|
|
|||
| Total Tax Receipts - Other Funds | 6,943.9 | 12,715.9 | 13,609.3 |
Analysis prepared using Macroeconomic Advisers, LLC Model of the U.S. Economy. The New York State Assembly Ways & Means Committee - Minority is solely responsible for all assumptions and conclusion. |
|
|