photo

An Economic
Doomsday
Awaits
New York
State

The High Cost of
the Inadequate
Education of
Hispanic Youth


A 2007 Policy Brief for the New York State Assembly Puerto Rican/Hispanic Task Force

Prepared by Clive R. Belfield, Ph.D.
Department of Economics
Queens College
City University of New York


NYS Seal Puerto Rican/Hispanic Task Force Seal
Part of an ongoing series of briefs prepared by the New York Latino Research and Resources Network on issues impacting Latino communities in New York State


Puerto Rican/Hispanic Task Force Seal

New York State Assembly
Puerto Rican/Hispanic Task Force

Hon. Sheldon Silver, Speaker
Hon. Peter M. Rivera, Chair

Staff
Guillermo A. Martinez, Legislative Director
Anton A. Konev, Senior Legislative Assistant
Michelle A. Butler, Intern
Herminio Quiñones, Intern
Justin Daly, Intern


Members

Hon. Carmen E. Arroyo

Hon. Brian P. Kavanagh
Hon. Jeffrion L. Aubry Hon. Rory I. Lancman
Hon. Micheal R. Benedetto Hon. Ivan C. Lafayette
Hon. Michael Benjamin Hon. Joseph R. Lentol
Hon. William F. Boyland, Jr. Hon. Margaret M. Markey
Hon. James F. Brennan Hon. Nettie Mayersohn
Hon. Alec Brook-Krasny Hon. Joan L. Millman
Hon. Karim Camara Hon. Catherine T. Nolan
Hon. Vivian E. Cook Hon. Daniel J. O’Donnell
Hon. Luis M. Diaz Hon. Felix Ortiz
Hon. Ruben Diaz, Jr. Hon. Amy Paulin
Hon. Jeffrey Dinowitz Hon. Jose R. Peralta
Hon. Adriano Espaillat Hon. Audrey I. Pheffer
Hon. Herman D. Farrell, Jr. Hon. Adam Clayton Powell IV
Hon. Sandra R. Galef Hon. James Gary Pretlow
Hon. Michael N. Gianaris Hon. Philip R. Ramos
Hon. Aurelia Greene Hon. Jose Rivera
Hon. Diane Gordon Hon. Naomi Rivera
Hon. Richard N. Gottfried Hon. William Scarborough
Hon. Aileen Gunther Hon. Anthony S. Seminerio
Hon. Carl Heastie Hon. Michele Titus
Hon. Sam Hoyt Hon. Darryl C. Towns
Hon. Rhoda S. Jacobs Hon. Mark Weprin
Hon. Hakeem Jeffries Hon. Keith L. Wright


Puerto Rican/Hispanic Task Force Seal

April 2, 2007

Almost 200 years ago, the great South American general and freedom fighter Simon Bolivar said that, “Nations march toward greatness at the same pace as their educational systems evolve.” His understanding of the power of an educated citizenry and its role in the prosperity of community and of country are undeniable truths today.

Yet today, simple truths like those remarked by Simon Bolivar have been forgotten in many parts of our country and state as tens of thousands of young people are failing out of schools, abandoning their education and increasing the rates of illiteracy in America. Either through neglect or willful inaction, the education crisis facing New York and our nation has reached a critical mass with grave consequences for the entire nation.

Latino students are more likely than black and whites to attend public schools that have the most students, the highest concentration of low-income students, the highest student-teacher ratios and are disproportionately taught by uncertified teachers. Simultaneously, the academic achievement gap has been widening. For those students that make it through secondary education and enter college, an overwhelming array of barriers are encountered. With only 10 out of every 100 Hispanic students (32 out of every 100 whites) obtaining at least a bachelor’s degree, the challenges facing administrators attempting to remedy this situation are substantial.

The strength of our state and national economies are now being undermined by the masses of uneducated in our communities. This report, for the first time in New York, categorizes the economic costs on our state if the present trend of low educational attainment persists for Hispanic youth. For states like New York with large Hispanic populations, the negative impact could be portrayed as the last nail in the coffin of a once great state.

It is my strongest desire that the New York State specific information contained in this report will help raise awareness and lead to diligent action by policymakers to address the problem. This is a priceless resource and one that requires profound gratitude to my Legislative Director Guillermo A. Martinez who conceived and helped direct the project, to NYLARNet Director Jose Cruz and to Dr. Clive Belfield for his dynamic research. To prevent an economic doomsday for New York, we must all begin to take this information seriously and hasten to act accordingly.

Sincerely,
signature
Peter M. Rivera, Chair
Assembly Puerto Rican/Hispanic Task Force


Contents
Preface
Summary
1  Introduction
2  Education in New York State
3  Government Spending in New York State
4  Fiscal Benefits of Education
4.1  The Effect of Education on Earnings and Tax Payments

4.2  The Effect of Education on Health Expenditures

4.3  The Effect of Education on Criminal Activity

4.4  The Effects of Education on Welfare Receipt

5  Total Effects of Inadequate Education for New York State
5.1  Fiscal Costs of Inadequate Education

5.2  Social Costs of Inadequate Education

5.3  Sensitivity Analysis

6  Conclusions
References
Tables
Table 1  Public High School Graduation Rates in New York
Table 2  Cohort of Persons Aged 20 in New York
Table 3  Annual State and Federal Spending in Millions
Table 4  Annual Local Government Spending in Millions
Table 5  Labor Market Status: All Persons Aged 21-64
Table 6  Lifetime Income: Present Value for All Persons Aged 20
Table 7  Lifetime Additional Tax Payments per Expected High School Graduate: Present Value at Aged 20
Table 8  Lifetime Health Savings per Expected High School Graduate
Table 9  Annual Crime Rate and Number of Arrests
Table 10  Lifetime Fiscal Crime Savings per Expected High School Graduate
Table 11  Lifetime Fiscal Welfare Savings per Expected High School Graduate
Table 12  Total Lifetime Fiscal Savings per Expected High School Graduate in New York: Federal Government
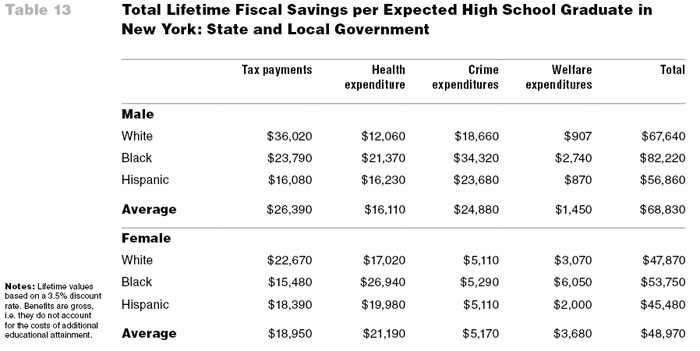
Table 13  Total Lifetime Fiscal Savings per Expected High School Graduate in New York: State and Local Government
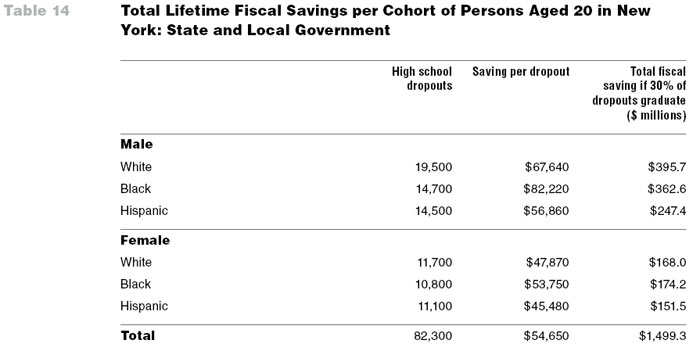
Table 14  Total Lifetime Fiscal Savings per Cohort of Persons Aged 20 in New York: State and Local Government
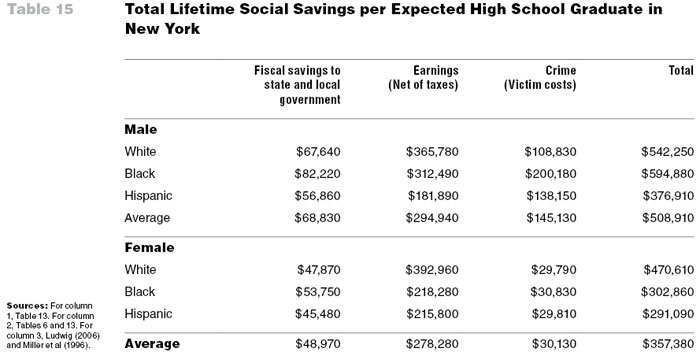
Table 15  Total Lifetime Social Savings per Expected High School Graduate in New York
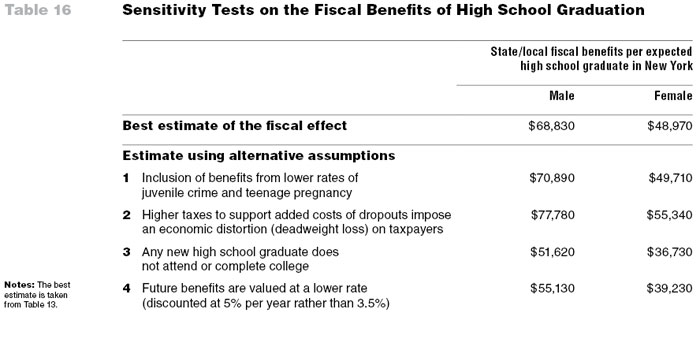
Table 16  Sensitivity Tests on the Fiscal Benefits of High School Graduation


Preface

One of the most difficult obstacles to the adoption of social policies is the idea that governmental action is destined to fail. Because fallible individuals create and run governmental institutions, institutional action is bound to be fallible as well. Those who follow this logic tell us that, at best, public policy can ameliorate social problems. In their view, ills such as poverty, illiteracy, homelessness, and crime will always be with us, no matter what social policy may attempt.

In this report on the costs of inadequate education, Dr. Clive Belfield tells us that it is unlikely that reform measures will result in equal educational attainment for all students. But unlike those who use institutional fallibility as a rationale for indifference and inaction, Dr. Belfield reassures us that given the nature of the problem of low educational attainment in New York State, particularly for Hispanic and AfricanAmerican students, even a small improvement in graduation rates would yield substantial economic benefits.

A public investment in reforms aimed at raising high school graduation rates could yield increased revenues for the state of over $16,000 and savings of more than $40,000 annually per graduating student. Imagine a reduction in the dropout rate of 30 percent. The annual savings for state and local governments would be of more than $1 billion. And the benefits of reform would not be just economic. For each additional graduating student the state would gain a more capable, better informed, and potentially more engaged citizen.

Of course, a 30 percent reduction in the dropout rate would not close the achievement gap in educational attainment. But no one really expects social policy to eliminate social problems in their totality or once and for all. In that sense, the idea that governmental intervention is useless because it is destined to fail is little more than an excuse for inaction based on a faulty assumption. It is a bad excuse and the economic analysis presented in this report demonstrates how awful an excuse it is from a fiscal as well as a social perspective. Dr. Belfield shows that the case for intervention on behalf of all New York students is fiscally and socially sound; in regards to male Hispanic and AfricanAmerican students the case he makes is compelling.

With this report NYLARNet provides fiscal ammunition to those who have already taken arms against minority underachievement in education. The report should also appeal to those who need to couch their altruism on economic rationality. New York State ranks 43rd in the United States in public high school graduation rates. To move the state up from this lowly status and to help the students that need the most help, we need substantial educational reforms now; in this case, the gains from governmental action outweigh the costs.

Dr. José E. Cruz, Director
New York Latino Research and Resources Network (NYLARNet)


Summary

This paper calculates the economic consequences for the state of New York from failing to ensure that all students graduate from high school.

New York has very large numbers of high school dropouts and the state ranks 43rd in the nation in public school graduation rates. On average, four out of ten public school students do not graduate on time. But the rate is much worse for Hispanic and African-American students. Only one-third of Hispanic and African-American male students graduate on time. The rates are higher for minority females but are still less than half. This means that, out of each age cohort of 330,000 individuals, 82,300 are high school dropouts.

photo

Across the population, low levels of education put pressure on public services. Government agencies in New York spend significant amounts on health, crime, and welfare services. Annually, state expenditures on these items alone are $20.4 billion. Local governments spend an additional $20.5 billion. Federal transfers to New York are $30 billion. A significant proportion of this spending is necessitated because the education system does not ensure that all students can graduate from high school and so enter adulthood fully prepared for productive citizenship.

Relative to dropouts, high school graduates earn more, pay more in taxes, and reduce the pressure on spending for health, crime, and welfare services. These differences hold even when we control for other attributes associated with dropping out, such as family disadvantage. The result is that each new graduate saves the taxpayer money and benefits the entire New York economy.

Using a consistent method and New York data, we calculate the exact amount of savings per additional high school graduate. We add up the lifetime differences between dropouts and graduates in tax contributions, spending on government health programs, spending on the criminal justice system, and welfare payments. This total gives us the fiscal return to New York per new graduate. We then add on the lifetime differences in net income and the social value of lower crime to determine the social return per new graduate. We report these effects by sex and race. We express the amounts as present values from the perspective of a 20-year old.

The fiscal and social returns to New York per new high school graduate are high. But the consequences for minorities, and particularly male minorities, are especially compelling.

For example, the differences between a Hispanic male high school graduate and a dropout are:

  • Increased earnings of over $250,000 across the working life.

  • For the federal government, the graduate will pay over $52,600 more in income taxes and generate savings of $26,100 to government health services, of $15,800 to the criminal justice system, and $600 to the welfare system.

  • For the state government, the graduate will pay $16,100 in additional taxes and generate savings of $16,200 for state health programs, $23,700 for the criminal justice system, and $900 to the welfare system.

In total, the federal government gains $95,100 for each additional Hispanic male who becomes a high school graduate. State and local governments would gain by $68,800. The total fiscal return is therefore $163,900. The social gains are even larger, at $376,900. Full results by sex and race are given below.

These economic values suggest greater public investments to ensure students graduate from high school. Many educational reforms may be considered as ways to raise the graduation rate. These include high quality pre-school, reducing class sizes in the elementary grades, raising the quality of teaching, and reform of urban public high schools. We do not perform a cost–benefit analysis here, but note that each reform costs significantly less per student than $68,800.

We recognize that it is unlikely that any reform will ensure that all high school students graduate. However, given the low graduation rate and the sizeable fiscal benefits per graduate, even fractional improvements would yield substantial savings in the aggregate. If the dropout rate was reduced by 30%, for example, New York State and local government would reap annual savings of $1.5 billion.


1  Introduction

The importance of education to an individual’s life opportunities is undeniable. Those with more education earn more, and are healthier and they are less likely to be involved in criminal activities or on welfare. These private advantages from education also have a public component: tax revenues are higher and the pressure for government spending on health, crime, and welfare is lessened. It is therefore in a state’s best interests to ensure that all children receive an adequate education. Yet, in New York State—as in many other states across the U.S.—large fractions of high school students leave school without graduating. Recent data show that for current cohorts of young adults in New York State, four out of ten in the public school system fail to graduate on time. These individuals are missing out on the private benefits of education, and the state is losing revenues while spending more on public services. This scenario creates a financial burden for taxpayers. This general argument is agreed upon by most economists (Carneiro and Heckman, 2002). To date, specific estimates regarding the size of the state’s economic burden as a result of low education levels have not been provided. Here, we ask: What is the fiscal and social cost when the citizens of New York State are not adequately educated?

We begin by mapping educational achievement and standards in New York State for current cohorts of students and young adults. This reveals in stark terms the low levels of educational attainment across the state. We then describe government spending in New York State, showing how much is spent on various services and by which levels of government. This provides a necessary context for our analysis of the economic burden of inadequate education. Next, we calculate the economic consequences of inadequate education on earnings, on tax revenues, and on spending on health, crime, and welfare. For each of these four domains we identify the causal effect of education and multiply this by the respective economic burden to get an overall total cost. Using a consistent accounting framework, we then add these costs up to provide a figure that shows what is being lost by failing to ensure that all students graduate from high school.


2  Education in New York State

We begin with a description of educational attainment across New York. Relative to the rest of the U.S., education levels in the state are not high. New York is approximately in the middle of the rankings based on NAEP math and reading scores in 4th and 8th grade. However, in state rankings of high school graduation rates, New York is 43rd and its absolute number of high school graduates is projected to decline in future decades (Tienda, 2007). Mostly, the students with low educational performance live in cities. Although the five largest urban areas in New York State enroll 40% of all students, they represent 80% of all students scoring below competency in 4th grade tests, leading Wyckoff (2006, 283) to conclude that “the problem of very poor student academic performance in New York is overwhelmingly an urban problem and disproportionately a New York City problem.” However, there are also many students with moderate skills across the state who may benefit from additional education.

photo

There are also significant gaps between the education levels of whites, African-Americans, and Hispanics (Holzman, 2004). The best available data is on the white-black gap in New York. Whereas 80% of white male students score ‘above basic’ in 4th grade Reading, the figure for black male students was 45%. For 8th grade, the gap is even wider, with rates of 83% and 44% respectively. These differences are strongest in the large urban public school districts. In Buffalo City school district there are approximately twice as many black students as white students, but the former are more than three times as likely to be placed in special education programs for mental retardation, for emotional disturbance, and for specific learning disabilities. The disparities are also clear for the largest district, New York City: there are just over twice as many black students as white students, but black males are 3.5 times more likely to be in special education programs and almost 4.5 times more likely to be suspended. Latino students are also lagging behind (De Jesús and Vazquez, 2005). Whereas 78% of students in the state passed the Regents exam in English in 2003, the pass rate for Latinos was 56%. For math, the pass rates were 75% and 49% respectively. There are also differences within the Latino population: 43% of Puerto Ricans do not have a high school diploma but the rates are 53% for Dominicans and 57% for Mexicans (with higher graduation rates reported for South and Central Americans). Importantly, De Jesús and Vazquez (2005) calculate that recent educational reforms intended to raise graduation standards in New York State have increased the drop out rate by a greater margin for minority students.

In this analysis, we define an adequate education as ‘high school graduation’ (not the GED, which is not thought of as equivalent according to Cameron and Heckman, 1993). Strictly, this is a minimal criterion because many occupations and opportunities are restricted to those with more than a high school diploma. Graduation as a standard also corresponds reasonably to the mandate in the New York State Constitution of ensuring that all students receive a “sound, basic education”. However, data shows that the state is not close to ensuring that all its citizens graduate from high school.

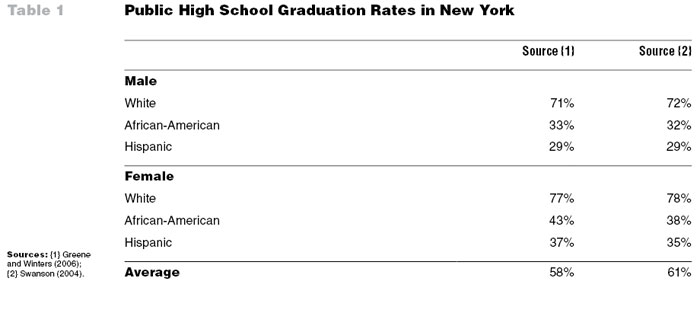
Table 1 shows the public on-time high school graduation rate in New York State based on two sources. Although there is considerable debate over the best method to calculate the number of high school graduates, the actual estimates are very similar.1 Overall, only six out of ten students will graduate on time. More striking are the differences by sex and race. Whereas approximately three-quarters of white males graduate on time, only one-in-three African-American and Hispanic students do. The overall graduation rates are better for females, but these are still very low for female minority students.

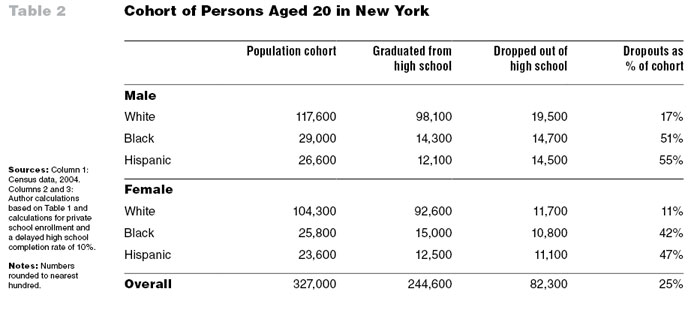
Table 2 shows the educational attainment of the current cohort of 20-year olds in New York State based on Census data for 2004.2 We focus on this age group to allow for persons who graduate from high school late but who still have a long working life ahead of them. This cohort is 327,000 individuals, of which two-thirds are white and approximately one-sixth are African-American and one-sixth are Hispanic. We then divide the cohort into those with at least a high school education and those who are dropouts. The majority of the cohort does graduate from high school but there are still 82,300 dropouts, which is 25% of all persons in the state aged 20. Given the different graduation rates by sex and race, the absolute total is spread roughly evenly across subgroups. So, even though there are four times as many whites as Hispanics in the population there are only slightly more white dropouts in absolute terms. Moreover, these are annual figures in that the following year’s cohort of persons becoming aged 20 will likely include a similar number of dropouts.

We recognize that many of these high school dropouts are immigrants, some of whom did not attend U.S. schools throughout childhood. Indeed, in New York City almost 14% of elementary school children are foreign-born (Schwartz and Stiefel, 2005). In fact, demographic projections suggest that the numbers of dropouts in the labor market are growing. Immigrants to the U.S. account for almost half of the population growth during the 1990s. One in three immigrants does not have a high school diploma and one-half do not have proficient English skills (Kirsch et al., 2007). However, our analysis strictly relates to the costs of inadequate education irrespective of where the person was educated. Of course, the low attainment of immigrants cannot be fully addressed by school-based reforms within the state. Nonetheless, our economic calculations are useful when considering policy solutions such as adult education, vocational training, or English-literacy training.

To get the full measure of lost educational attainment we must also account for the likelihood that a high school graduate would continue his or her education. Becoming a high school graduate will enable an individual to attend college if they wish, further enhancing their educational attainment. Therefore, we identify an ‘expected high school graduate’, i.e. someone who becomes a high school graduate with the potential to progress on to college and complete an associates or bachelor’s degree. We use the probabilities for sex and race created by Levin et al. (2007) based on the 1988 National Educational Longitudinal Survey and the 1996/2001 Beginning Postsecondary Students Longitudinal Study.3 On average, for every 100 new high school graduates across the state, approximately 80 are expected to terminate their education after high school, 15 would continue on and obtain an associates degree (or ‘some college’) and 5 would go on to obtain at least a BA degree. This progression rate is conservative. It assumes that new high school graduates attend college only at the same rate as those in the lowest quartile in reading nationally, i.e. only education levels are being increased, not family income or the other attributes correlated with college attendance. For this analysis, the additional college attainment is valuable: the economic benefits of education do not end after high school graduation but increase as individuals go on to college.


1  Studies vary in how they account for private school enrollments, special education students, and migration. This literature is reviewed in Orfield et al. (2004).
2  Use of the Census data is not sensitive to classification according to either GED status or incarceration.
3  The progression rates are calculated by sex and race for termination after high school, after ‘some college’, and after a BA. The rates for males are 80/12/8 (white), 75/17/8 (African-American), and 77/18/5 (Hispanic). The rates for females are 81/14/5 (white), 83/11/6 (AfricanAmerican), and 85/11/4 (Hispanic).


3  Government Spending in New York State

We can see the consequences of inadequate education by examining total public spending in New York State. These figures indicate how much is spent on specific government services each year and where the spending is funded from. In particular, we are interested in how much is spent on health, crime, and welfare versus how much is spent on education.

photo

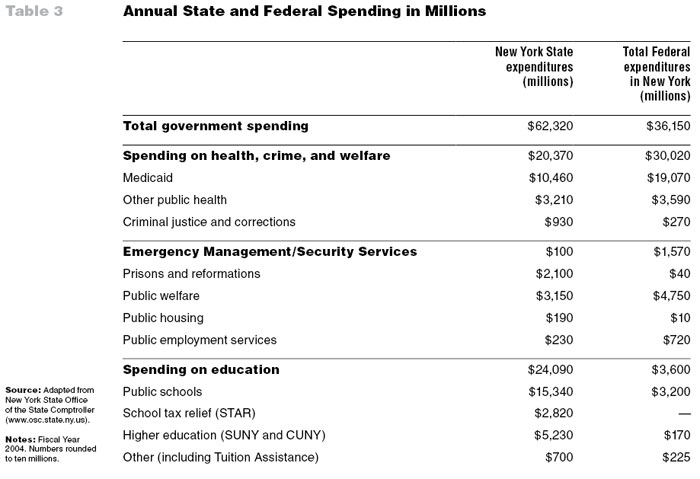
Table 3 shows annual government expenditures at the state and federal levels within New York State. Total annual spending by state government agencies is $62.3bn and a large proportion of this is allocated to health, crime, and welfare. Medicaid spending is $10.5bn, spending on the criminal justice system is $3.2bn, and welfare spending is $3.6bn. One-third of total state government resources are deployed directly on these three components, amounting to $20.4bn annually. Total federal spending in New York State is also significant: the annual total is $36.2bn in subventions. In fact, a large proportion of the transfers to New York State from the federal government are allocated for health, crime, and welfare. By far the largest federal spending item in the state is Medicaid. Annually, $19.1bn is spent, not including other public health services. Criminal justice system expenditures are also large, mainly composed of $1.6bn for emergency management services. Public welfare subsidies are also significant, totaling $4.8bn. Overall, federal government spending in New York State on these three domains alone amounts to $30bn, which is 83% of total federal transfers.

The comparison between state and federal spending on health, crime, and welfare with spending on education is illustrative. New York spends significantly more on the former set of services than on the public school system ($20.4bn versus $15.3bn). The state also allocates approximately one-third as much to higher education as to the school system ($5.2bn versus $15.3bn). The federal accounts are even more striking: federal spending on education is only 10% of its total transfers to New York ($3.6bn out of $36.2bn).

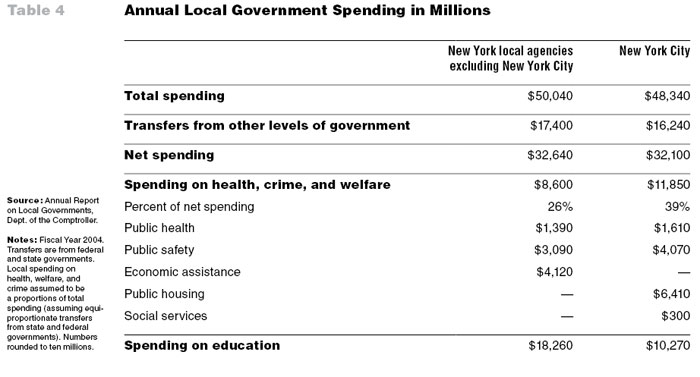
Table 4 shows the total local government spending divided into spending outside and within New York City. Approximately, the spending totals are the same at $50bn and both areas receive similar monetary transfers from other levels of government at $17bn. As with state and federal agencies, local government spending in New York is heavily weighted toward health, crime, and welfare services. Outside New York City, $8.6bn is spent on these three components, representing 26% of local spending net of transfers. Within New York City the burden is significantly larger: $11.9bn, which is 39% of local spending net of transfers. Local agencies do invest heavily in education, however. Outside New York City education spending is $18.3bn. Within New York City it is $10.3bn, an amount approximately equal to that spent on health, crime, and welfare.

Viewed in the aggregate, government spending on health, crime, and welfare is very large: it is over $70bn annually within the state from various sources. Given the entire population of New York State is 19.3 million persons, this represents per capita expenditures of over $3,500.4 This is just the direct fiscal cost and does not include the social costs (such as the costs to the victims of crime). Importantly, these aggregate figures suggest that the costs of inadequate education are potentially very high. We now calculate the public and social costs of failing to ensure that all students in New York receive an adequate education.


4  Also, the state spends 30% more on these items than it does on education. In part this is because the burden for education spending is disproportionately on state and local agencies and federal allocations are mostly for health, crime, and welfare. We explore the consequences of this funding imbalance in our conclusions.


4  Fiscal Benefits of Education

4.1  The Effect of Education on Earnings and Tax Payments

Persons with higher levels of education earn more and therefore pay more taxes. The education-earnings relationship has been tested repeatedly in labor economics and it is widely accepted that education causes higher earnings (rather than simply being correlated with them, see Rouse, 2005). Consequently, when individuals are not adequately educated the state is losing potential economic income and tax revenues.

Earnings Advantages for High School Graduates. We use earnings data on New York State residents from the Current Population Survey (CPS).5 The CPS is the best available data, but it is not perfect. First, it only includes the civilian non-institutionalized population, so persons in prison are not counted. Because dropouts are more likely to be incarcerated, their average income is overstated relative to graduates. We adjust for differences in incarceration rates by sex and race although it turns out that this adjustment does not substantially influence the results. Also, we cannot separately identify persons with GEDs from high school graduates in the CPS. This biases the results in a conservative direction because GED-holders do not have the same labor market success as high school graduates. Finally, we note that the CPS is generally recognized to under-survey high school dropouts. This too introduces a conservative bias because these excluded persons are likely to have lower incomes.

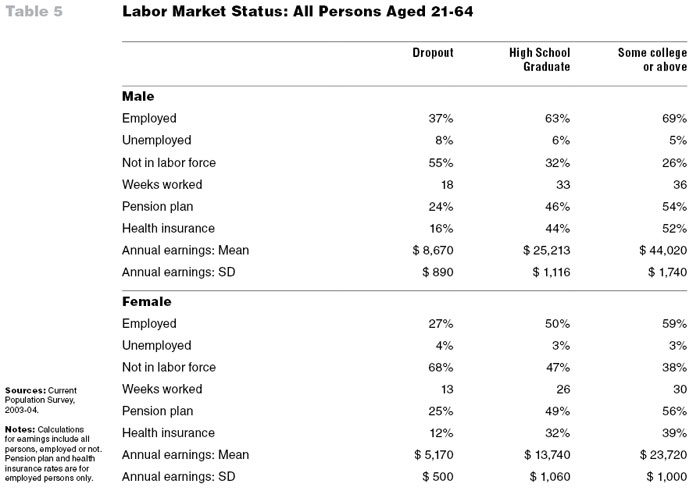
Table 5 shows the differences in labor market status by sex across education levels for New York State residents as of 2003-04. These cross-sectional figures are for all persons, including those who are not working. There are substantial labor force advantages for high school graduates and for those who go on to college. Those with more education work more, have more stable employment, are employed in jobs with more generous benefits, and earn more.6 For males the disparities are large. Whereas only one-in-three dropouts is employed the rate is twice as high for graduates, and many of the latter group may be enrolled in college (part of the category ‘not in the labor force’). Whereas one-in-seven dropouts who are working have health insurance, the rate is one-in-two for graduates and the college-bound. Incomes are also higher for persons with more education: they are three times higher for high school graduates and five times higher for persons with at least some college education. The picture is similar for females but the effects of education are relatively smaller in magnitude. This stems from the fact that female’s labor force participation rates are significantly lower.

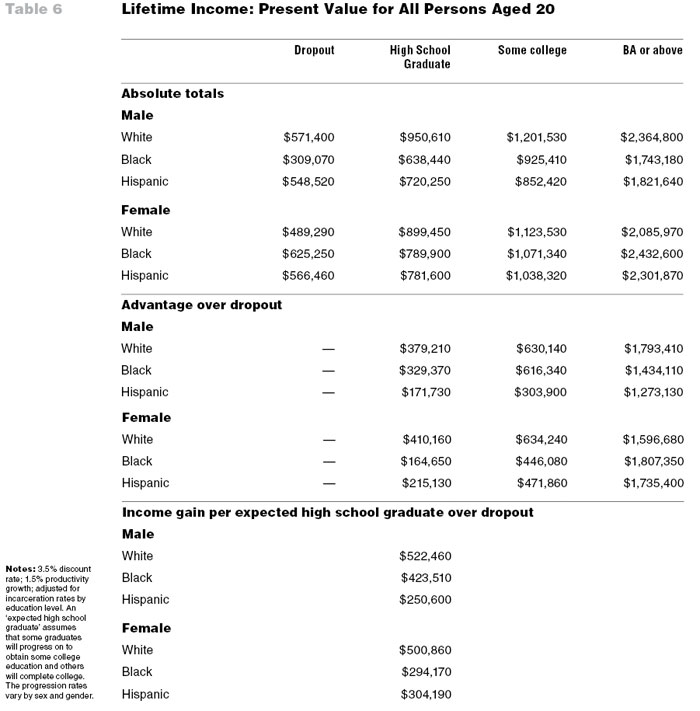
These annual differences persist over the life course, leading to significant lifetime advantages for high school graduates. Table 6 reports the lifetime incomes across four education levels by sex and race for a person who is aged 20 in 2004. Lifetime incomes are calculated based on the following assumptions: the current distribution of incomes persists for this cohort as it ages; productivity grows by 1.5% per annum; all individuals retire at age 65; and individuals discount future incomes at a rate of 3.5% per annum.7 The top panel of Table 6 gives the absolute total lifetime incomes. At aged 20 a male dropout will expect to earn $524,000 over his lifetime. A high school graduate’s expected earnings are $863,000. Those who go to college will earn even more: those with ‘some college’ will earn $1,102,000 and those with a BA or above will earn $2,177,000. Females will reap proportionately similar advantages from high school graduation and college enrollment. The advantages of education are evident for each racial grouping.

photo

The middle panel of Table 6 shows the net lifetime gain over a high school dropout. These lifetime gains are substantial. A male high school graduate will expect to earn $339,000 more than a dropout; a female graduate will earn $235,000 more. For those who complete college, the lifetime income advantage over a high school dropout is $1,563,000 for males and $1,002,000 for females. The bottom panel of Table 6 (page 45) translates these gains for high school graduates, for those with some college, and for college graduates into a single figure: the income gain per ‘expected high school graduate’ over a dropout. Each additional male ‘expected high school graduate’ will earn $488,000 more than a dropout; for each female ‘expected high school graduate’ the earnings gain is $325,000. These amounts represent lost economic activity across New York State by failing to ensure each person is educated to high school graduate standard.

Additional Tax Payments by High School Graduates. The income gains for graduates are used to estimate the amount of extra tax they pay. To estimate the income tax payments we apply the program TAXSIM model (version 7) derived by the National Bureau of Economic Research. TAXSIM simulates an individual’s U.S. federal and state income taxes (excluding rents or expenses)8. We follow the same method as for the earnings gains: we estimate total lifetime tax contributions by education level; then we calculate the extra payments over dropouts; and then we combine these to estimate the extra payment per expected high school dropout.

Calculating tax liabilities is complicated by two factors. First, when a family files their taxes it is not possible to extract the liability due to each individual (some of the tax code is specific to the family unit). Family filings will therefore be an imprecise indicator of who incurred what liability. Therefore, we generate two estimates of tax contributions. One assumes all individuals do not live in families and are “single”; the other assumes that if there is a male present, he is the head of the household. We take the average of these two estimates of tax payments.

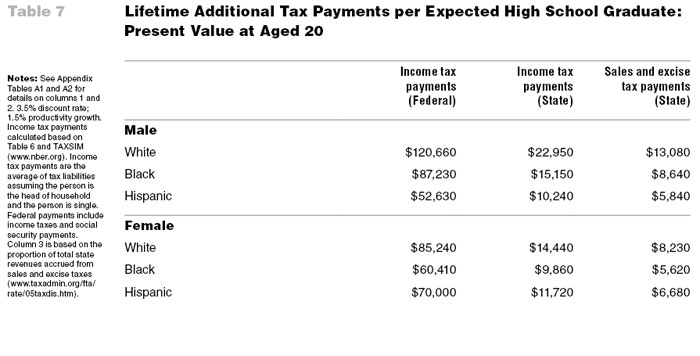
Table 7 shows the additional tax contributions to government agencies per expected high school graduate. Column 1 shows that additional federal income tax payments range between $87,000 and $121,000 for males and $60,000 to $85,000 for females. Column 2 shows the differences in state income tax payments; these range up to $23,000 for males and $14,000 for females. Column 3 reports the additional payments in state sales and excise taxes.9 These are calculated as a function of state income tax payments, based on the proportions of revenues that each tax represents. For New York State the distribution of tax revenues is as follows: 56% of revenues are from income taxes; 22% from sales taxes; 10% from selective excise taxes; 6% from corporate tax; and 6% from other taxes. Therefore, state sales and excise taxes are 0.57 (=32/56) times as large as state income tax revenues. The amounts range from $5,600 to $13,100. The full loss in tax revenues is the sum of these three columns.

4.2  The Effect of Education on Health Expenditures

More education is associated with changes in health behaviors and better health. In an extensive review, Cutler and Lleras-Muney (2006) find education to be strongly negatively associated with diagnoses of a range of conditions (including heart conditions, strokes, hypertension, high cholesterol, and diabetes) as well as depression and smoking. These health gains have benefits at the individual level, but they also reduce fiscal pressure on government-supported health programs. Specifically, Medicaid eligibility is means-tested, so increased education—even simply through its effect on earnings—lowers enrollment. In addition, Medicare is available for persons under 65 who qualify for social security disability income (SSDI) and receipt of SSDI is more common among dropouts.

New York State does not rank highly in terms of health relative to the rest of the nation.10 Whereas the national average for diabetes is 7.3% of the population, in New York State it is 8.1%. The state ranks 9th highest in rates of heart disease per 100,000 persons, 14th highest in asthma rates, and 17th in terms of childhood obesity. In total there are 2.2 million persons within the state on Medicare and 3.1 million enrolled in Medicaid for the non-elderly. Annually, as shown in Tables 1 and 2, New York State spends $13.6bn on Medicaid and other health programs, federal contributions are $22.9bn, and local expenditures are $3bn. Therefore, increasing educational attainment should reduce the incidence of ill health; and reduced enrollment in public health programs should yield significant government savings.

Reported use of government health services is lower for those with more education (Muennig, 2005). Medicaid enrollment rates are significantly lower for those with more education. Whereas 15% of white male dropouts are enrolled, the rate is 5% for high school graduates, 3% for those with some college, and less than 1% for college graduates. The effects are even stronger for groups who enroll at high rates: for example, 51% of African-American female dropouts are on Medicaid, compared to 22% of high school graduates and 3% of college graduates. Medicare coverage rates are similarly stratified by education level. Annually, 8% of dropouts are covered, compared to 4% of high school graduates and 1% of those with a college degree.

Therefore, raising the rate of high school graduation should reduce public expenditures on health programs. We adapt estimates calculated by Muennig (2005), weighted for New York State prices and controlling for demographic differences between New York and the rest of the U.S.11 On average, Muennig (2005) estimates that the lifetime per-person public spending on Medicaid and Medicare (under 65) is: $58,500 per dropout; $22,500 per high school graduate; $16,000 for those with some college; and $4,000 per college graduate. So, the cost per dropout is over twice that of a high school graduate and almost fifteen times that per college graduate.

Moreover, these estimates are likely to be conservative because Medicaid reimbursements are typically lower than the actual costs of treatment.

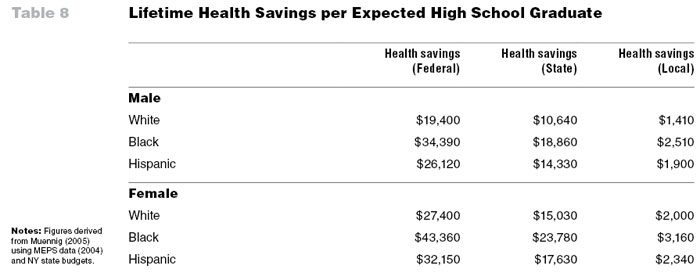
Table 8 shows the lifetime health savings per expected high school graduate for New York State. The savings can be divided into those accruing to federal, state, and local agencies. Muennig (2005) does not include local health expenditures, so we add this on to his estimates based on the proportion of health spending that is funded by local government. The total lifetime savings per high school graduate are significant. Federal savings range from $19,400 to $43,360. State savings range from $10,640 to $23,780. Local savings range from $1,400 to $3,160.

4.3  The Effect of Education on Criminal Activity

Persons with less education are more likely to be involved in criminal activity and high school dropouts are disproportionately represented in the state’s prison system.12 The causal effect of education is two-fold: education directly reduces criminal behavior; and, because education is associated with higher incomes, it indirectly reduces the incentive to commit crime (Farrington, 2003; for juveniles, see Levitt and Lochner, 2001; for incarceration rates, see Arum and Beattie, 1999). The effects are stronger for males and vary by race but are evident across all subgroups. However, the rates are magnified for black males, who are incarcerated at rates 6-8 times those of white males (Pettit and Western, 2004, 164). Based on data for California, over the early lifetime up to age 35 a black male dropout is almost certain to have been incarcerated at some point (Raphael, 2004); nationally, the probability is 60% for black male dropouts but less than 20% for high school graduates (Pettit and Western, 2004). Latino dropouts are also disproportionately incarcerated, although the causal effect of education has not been precisely established.

The economic consequences of crime are substantial, both to victims and to the taxpayer. Victims bear a large direct cost in terms of lost property and impaired quality of life (Anderson, 1999). Additionally, all citizens incur costs to avoid being a victim of crime (e.g. through higher insurance premiums or spending on personal crime prevention devices). The taxpayer incurs costs in paying for the criminal justice system (policing and the courts), imprisonment for offenders (as well as parole and probation), crime prevention costs (e.g. budgets for the DHS, DEA, and ATF), restitution for victims, publicly-provided medical care, and from lost tax revenues when victims are off work. Tax revenues are also lost because criminals are not participating in the formal labor market (Holzer et al., 2004). Nationally, Ludwig (2006) has estimated a total cost of crime at over $2 trillion dollars, equivalent to 17% of annual GDP. Over the last decade, expenditures on incarceration have been rising faster than the rate of inflation (Stephan, 1999). Importantly, a large fraction of crime is committed by young adults, such that the costs of crime are incurred almost immediately after an individual leaves school.

photo

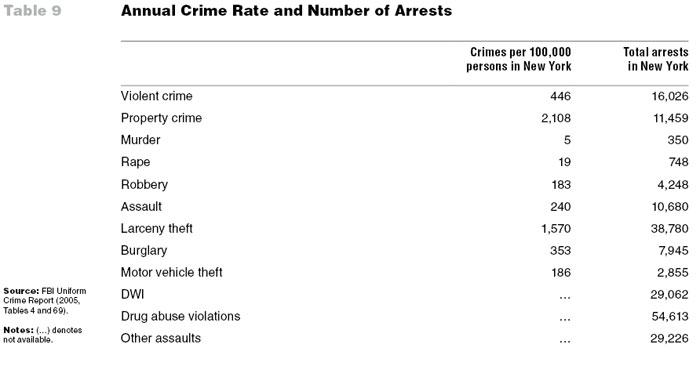
Criminal activity in New York State is reported in Table 9. Data on arrests is more readily available than data on crimes, but the latter significantly exceeds the former (BJS, 2001; FBI, 2004). Most crimes are misdemeanors, which generally do not impose large costs. So we focus on the major crimes of murder, sexual assault, violent and property crimes, and drugs-offences.13 Also, many crimes may not be reported. Per 100,000 persons in the state there are 446 violent crimes, over 2,100 property crimes, 5 murders, and 19 rapes per year. These rates are lower than the national average for every crime except robbery such that—relative to the rest of the U.S.—the crime rate in New York is not especially high. However, crime is disproportionately found in New York City relative to the rest of the state (with the exception of DWI instances). These crimes translate into arrests, of which the most common are for drug abuse violations, larceny-theft, and DWI offenses. Annually, the number of arrests is substantial as shown in column 2 of Table 9. Finally, this criminal activity means that there are almost 63,000 persons incarcerated within the state, as well as an additional 120,000 persons on probation and 54,000 persons on parole.

Of the entire set of criminal activities, almost half (48%) involves individuals who have less than high school education. Increasing the rate of high school graduation should therefore reduce crime for this group. Using Census and FBI data Lochner and Moretti (2004) identify the causal effect of becoming a high school graduate: it reduces crimes by 20% for murder, rape, and violent crime, by 11% for property crime, and by 12% for drugs-related offenses. These reductions generate corresponding effects on months of incarceration and months of parole.

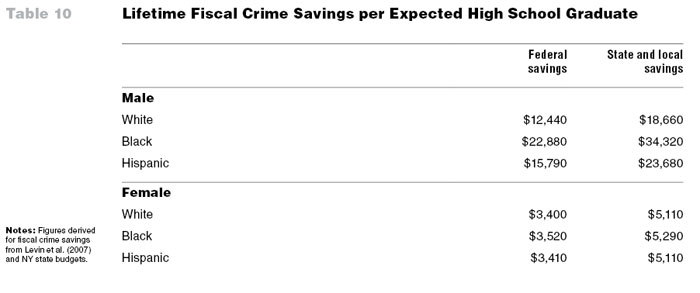
This reduction in crime would yield significant savings, even as we focus only on the high cost crimes. Again, we calculate the lifetime cost savings for the cohort of individuals currently aged 20 and assume that new high school graduates may also progress on to higher education. This has a disadvantage in that it excludes all juvenile crime; this is roughly one-third of all crimes although many juvenile crimes are misdemeanors which do not result in a prison sentence. For the fiscal costs, we use estimates developed nationally by Levin et al. (2007).14 These estimates are conservative because they are considerably lower than those derived from research based on how much people are willing to pay for a reduction in the crime rate (Cohen et al., 2004).

Table 10 shows the cost saving per expected high school graduate, divided according to federal and state/local government. The federal savings are significant, ranging from $12,500 to $15,800 for males and approximately $3,500 for females. Larger savings are accrued by states, reflecting the larger amount of spending at the state and local level on criminal justice system services. These savings range from $18,700 to $34,300 for males and approximately $5,200 for females. There are significant differences in gender and race, with females imposing a considerably smaller burden than males. These differences arise because of variations in criminal activity, in arrests, and in the effect of education on crime. For reasons noted above they are probably conservative in terms of the savings that would actually be realized.

4.4  The Effects of Education on Welfare Receipt

Greater educational attainment is associated with lower receipt of public assistance payments or subsidies (Grogger, 2004; Jayakody et al., 2000; Waldfogel et al., 2005). Education directly reduces the probability of attributes and characteristics which raise welfare eligibility, such as single motherhood. Education also raises incomes, which in turn reduces eligibility for means-tested programs.15

In 2004, New York State reported 101,200 households in receipt of Section 8 housing vouchers, 95,300 adults receiving cash assistance from Temporary Assistance for Needy Families (TANF), 311,000 households receiving food stamps, and 287,800 receiving safety net assistance. (There are also 1.65 million children on Medicaid, including the State Children’s Health Insurance Program, SCHIP). Welfare caseloads are predominantly female (approximately by a factor of ten), with black and other minority groups also disproportionately represented. As noted above, all-source welfare spending is significant such that reductions in welfare incidence should result in taxpayer savings. Again, we calculate the monetary savings from reductions in welfare receipt over the lifetime for those who are 20-year-old high school graduates relative to 20-year-old dropouts.

National data indicates that receipt of TANF cash assistance, housing assistance, and food stamps is strongly correlated with low education (DHHS, 2005; Barrett and Poikolainen, 2006; and Rank and Hirschl, 2005).16 Less than 4% of TANF recipients and less than 2% of housing assistance welfare recipients have some college education; and more than two-thirds of all high school dropouts will use food stamps during their working life. Using the CPS, Waldfogel et al. (2005) estimate welfare receipt by education level, controlling for other factors. Relative to a high school dropout, a graduate is 40% less likely and a college graduate is 62% less likely to receive TANF. Similarly, high school graduates are 1% less likely, and college graduates are 35% less likely, to receive housing assistance. For food stamps, the respective probabilities are 19% and 54% lower (Rank and Hirschl, 2005). Looking only at females, Grogger (2004) estimates that high school graduates are 68% less likely, and college graduates are 91% less likely, to be on any welfare program.

We now combine these impacts with the unit costs of welfare. For TANF, the average monthly benefit is approximately $355 and for food stamps it is $85 (DHSS, 2004; Barrett and Poikolainen, 2006). To these we add administrative costs of 15%. For housing assistance, we apply the total budgeted expenditures in 2002 of $36,620 million (2004 dollars) across the 5,125,000 total households (CRS, 2004, 235). Annual spending per household on housing assistance is $7,150. State-level welfare payments are counted as a proportion of these federal payments. We also weight each payment to account for the relative price level in New York.

Total lifetime costs are the calculated as the impact times the unit cost each year. Eligibility for these three programs is not based on age, although younger families with children are more likely to qualify. Since TANF is time-limited, we assume no receipt after the cohort reaches the age of 40. Lifetime figures are present values from the perspective of an individual currently aged 20, applying a discount rate of 3.5%.

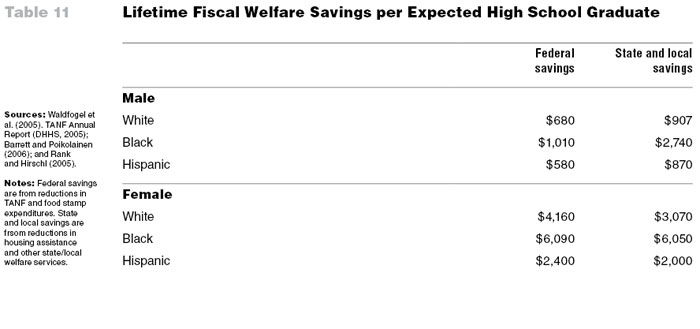
The fiscal welfare savings per expected high school graduate are reported in Table 11. The amounts are split between federal and state/local government according to which agency funds each welfare program. The largest proportion of the savings comes from reductions in TANF payments although there are non-trivial savings in housing assistance and food stamps as well. Savings for male dropouts are approximately $2,000, but for female dropouts they are at least double. Compared to the other domains of health and crime, these total figures are low. The explanation lies in the fact that welfare is time-limited and children and the elderly receive high proportions of welfare funds. Additonally, males do not receive much welfare (but they are a large proportion of all dropouts). Also, we have omitted benefits for other federal welfare programs where we have insufficient evidence. Nevertheless, the cost savings are still significant, particularly for female dropouts.


5  Data from 2003 and 2004 are combined to ensure a sufficient sample size. The sample only includes those who completed at least 9th grade for the estimates of income and tax revenue losses. All figures are weighted using the sampling weights provided by the Bureau of Labor Statistics and all monetary figures are inflated to 2004 dollars using the Consumer Price Index for Urban Consumers. Data were provided by Professor Rouse, Princeton University.
6  We do not count differences in earnings across youth up to age 20. These earnings are typically low, sporadic, and interrupted by school and college commitments. For high school dropouts, the CPS shows very high proportions are not in the labor force. Also, we note that the standard deviations of income are quite small, suggesting that our sample is not widely dispersed.
7  The first of these assumptions is perhaps the most debatable. We are assuming that the current distribution of income by sex, race, age, and education will apply to the 2004 cohort. For example, if white male 40-year old graduates currently earn double that of white male 40-year old dropouts, then this ratio will hold for the 2004 cohort when they reach 40 (in 2024). This assumption is probably conservative: in recent decades dropouts have been losing ground to graduates, such that the ratio will probably grow. The choice of the discount rate is based on the review by Moore et al. (2004).
8  This approach follows that by Rouse (2005). We insert zero values for: dependent exemptions; number of taxpayers over 65; dividend income; taxable pensions; other property income; child care expenses; property taxes; and capital losses. This assumption is likely to bias downward the gains from education. Because TAXSIM does not fully adjust for possible deductions, it may overstate the amounts that individuals with more education pay. However, because the income tax code is (somewhat) progressive, and our income estimates are averages for all persons, there is a possibility that tax payments by those with more education are understated.
9  Local property tax payments are excluded. Rouse (2005) estimates that the differences in payments by education level are probably small although the main reason for exclusion is that there is no available evidence on how property tax payments vary by education level.
10  www.statehealthfacts.org
11  For simplicity, this analysis excludes several factors. First, it does not consider the effect of education on changing rates of private health insurance enrollments. Second, it ignores the possibility that education increases usage of the public health system (for a given health condition). Third, it omits mortality effects despite education’s association with longevity (for example, Wong et al. (2002) find that high school graduates live about 6 to 9 years longer than high school dropouts).
12  Nationally, dropouts represent less than 20% of the population but they account for over half of all state prison inmates and two-fifths of local prison inmates (Wolf Harlow, 2003).
13  Property crime is defined as burglary, larceny-theft, motor-vehicle theft, and arson. Drugs-related crimes are included because of the high incidence of such crimes and because they are often associated with other crimes such as robbery and assault.
14  These estimates distinguish between costs per arrest and costs per crime for the five major types of crime and account for how crime diminishes with age. They include policing costs, trial and sentencing costs, and incarceration costs (adapted from Belfield et al., 2006; BHS, 2002). They also include: costs to the government in payments to victims, based on the National Crime Victimization Survey; costs estimated by Cohen (2005) of payments from the Crime Victims Fund; costs to federal agencies committed to reducing crime (notably for the war on drugs); and costs estimated by MacMillan (2000) on the annual loss of tax revenues because victims are off work. We apply a weighting to account for the relative prices in New York State.
15  Higher attainment among those who meet eligibility requirements increases the probability of receiving such payments because more educated persons are better able to navigate the welfare system and claim benefits to which they are entitled. This navigation effect offsets somewhat the gains from reduced welfare entitlement (see Osborne Daponte et al., 1999).
16  Because of a lack of data on receipt by education level we do not include other federal means-tested programs (such as education, services, job training, and energy aid). For TANF, less than half of expenditures are directly allocated to cash assistance. Economically important programs include EITC, Supplemental Security Income, and nutrition programs (national spending on these is $84bn).


5  Total Effects of Inadequate Education for New York State

The individual effects of education on earnings, health, crime, and welfare are economically important. Collectively, they represent a strong argument for further measures to ensure that all New York State citizens are adequately educated.

5.1  Fiscal Costs of Inadequate Education

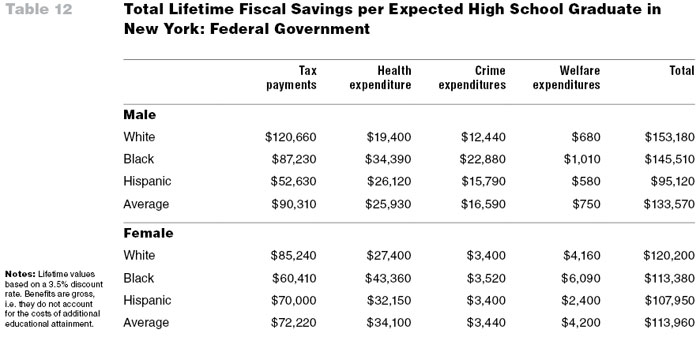
Table 12 shows the total fiscal savings to the federal government if a high school dropout were instead to graduate from high school. We note that these are gross benefits and do not account for what it costs for the necessary educational interventions to raise the graduation rate or fund college progression contingent on graduation. The federal government mainly benefits from higher tax revenues, but other items are also affected. The overall lifetime saving would be $133,570 for each new male high school graduate and $113,960 for each new female high school graduate. The amounts vary by race and gender, but they are substantial for each  group.

Table 13 reports the equivalent fiscal savings for state and local governments. These savings are smaller than for the federal government, reflecting the latter’s role in collecting income taxes. Nonetheless, these savings are still large, at $68,830 for males and $48,970 for females. These magnitudes may be thought of as the amount of money that government agencies could invest in the education of a 20-year-old and still break even.

The aggregate consequences of inadequate education are evident when we multiply the amount per graduate by the number of potential graduates. Table 14 shows in column 1 the number of high school dropouts in New York State only for persons aged 20. Disproportionately, these individuals are AfricanAmerican and Hispanic males. The state/local fiscal saving is given in column 2. The final column is the product of these two numbers assuming that 30% of the dropouts become graduates. This assumption—that the dropout rate could be reduced by 30%—is debatable. We note that one-third of the dropouts do not complete 10th grade and so we are skeptical that educational interventions are available that would ensure these persons would graduate from high school. Ideally, resources should be invested to ensure that all students have a chance to graduate. But the research literature on what causes students to dropout is not compelling regarding effective interventions. There are many factors unrelated to education that cause students to drop out (such as teenage pregnancy, financial constraints, and family circumstances, see Rumberger, 2004). Nonetheless, we believe a 30% reduction in the dropout rate may be feasible, if educational interventions were offered to disadvantaged students.

A fall in the dropout rate by 30% for one cohort of students in New York State would yield total fiscal savings to state and local government agencies of $1,499 million. This is an annual ‘investable fund’ because the next year’s age cohort will generate the same amount of savings. These savings are largest for males and are particularly strong for African-American and Hispanic communities. These populations are considerably smaller than the white population in the state, yet the aggregate benefits are quite close.

5.2  Social Costs of Inadequate Education

Finally, it is important to include the social costs to the population of the state. The social costs are the entire costs to the state population from low education. The economic value of this social cost is given in Table 15. Clearly, this social cost includes the costs to the taxpayer, but there are two other significant burdens.

photo

The first burden is that families where education is low earn less. As shown in Table 6, the biggest loss from low education is to the individuals themselves in terms of lower lifetime earnings. This loss in gross income is reported in Table 6 and so we subtract tax payments to get the loss in net income from inadequate education. This amount is reported in column 2 of Table 15. In addition, there are social costs due to the crime committed by high school dropouts. These social costs are primarily imposed on the victims of crime but all persons make private expenditures to prevent being the victim of crime. (There are also opportunity costs of criminals’ time, but we do not have accurate data on these costs). Social costs are much harder than fiscal costs to estimate with precision: Ludwig (2006) estimates these social costs are 4.5 times larger than the fiscal costs; research by Miller et al. (1996) yields a factor that is closer to 2.5. Applying the average of these two, but recognizing the imprecision, we report the social crime savings in column 3 of Table 15. These are very large numbers, reflecting the fact that the main burden of crime is on the victim and not the taxpayer. They are also costs that are incurred entirely by citizens within the state. Notably, most victims of crime are the same race as the perpetrators, so reporting these social costs by race has a broader implication for social justice.

The final column of Table 15 shows the social costs of inadequate education. The social cost of failing to ensure high school graduation is $508,910 for males and $357,380 for females. The amounts vary by race, but remain substantial for each group.

5.3  Sensitivity Analysis

The economic benefits of investments to raise high school graduation rates in New York State are very large. Of course the exact magnitudes depend on the assumptions used in our model. Throughout this paper we have applied conservative rather than optimistic effects of education and low estimates of unit costs. Also, by relying on the Current Population Survey we are probably overstating the economic conditions of the most disadvantaged: Schmitt and Baker (2006) find that the CPS undercounts the poorest members of society, particularly minorities with low education levels.

Moreover, direct sensitivity tests indicate that the overall figures are robust to alternative assumptions and further refinements. Table 16 summarizes our sensitivity tests in comparison to our ‘best estimate’ baseline for state/local fiscal savings of $68,830 for males and $48,970 for females. We derive four models based on alternative assumptions.

Model (1) includes additional benefits of education in terms of reduced juvenile crime and lower rates of teenage pregnancy.17 These were not included in the baseline model because they accrue before the age of 20, which is the initial threshold age for comparison. Nevertheless, there is evidence that higher levels of education will yield gains in both areas. We therefore include cost savings from juvenile crime based on the savings in adult crime and from teenage pregnancy.18 These additions raise the total burden to $70,890 for males and $49,710 for females.

Model (2) includes an adjustment for the cost of collecting government revenues to pay for health, crime, and welfare expenditures. This cost is typically referred to as the ‘deadweight loss’ of taxation. Fullerton (1991) estimates this deadweight loss at 7-25 cents per dollar of tax revenue raised; Allgood and Snow (1998) estimate it at 13-28 cents. Taking the average of these estimates, we calculate that the fiscal benefit may be as high as $77,780 for males or $55,340 for females.

Model (3) assumes that any new high school graduates will not obtain any more education beyond high school. This is implausible because data from several sources show that even the most disadvantaged groups attend college at reasonably high rates. Making this assumption reduces the economic benefits of raising the high school graduation rate but even under this pessimistic assumption the fiscal benefits remain large, at $51,620 for males and $36,730 for females.

Finally, model (4) assumes that any future benefits of education are valued at a lower rate (i.e., discounted more heavily). Arbitrarily, we apply a discount rate of 5%, which is significantly above the conventional rate. Again, this reduces the fiscal savings, but they remain substantial for both males and females.

It is possible that—if many more persons become high school graduates—the economic benefits to all graduates would fall. Greater competition for each job would mean workers would have to accept lower wages. However, the experience of recent decades undermines this argument. Despite significant increases in the numbers of college graduates, the pay-off to college has not fallen; in fact, it has risen (Barrow and Rouse, 2006). The likely explanation is that the demand for high-skill workers has risen faster than the supply (Acemoglu, 1998). Also, the new high school graduates would only be a fraction of the total number of workers aged 21-65 in the New York State labor market. Any new flow would take decades to change the total stock of the graduate workforce.

Potentially, the aggregate benefits may be greater than the sum of the individual benefits if we consider ‘spillovers’. One important spillover is statistical discrimination: minorities who are high school graduates find it harder to get jobs in part because they are perceived only to have the (lower) skills of the average for their group. Recent research has shown that, in regions where there are more unemployed African-Americans, even high-skilled African-Americans are less likely to be employed (Pager, 2003; Raphael, 2004; Roberts, 2004). Changing education levels may help change perceptions about the employability of all members of a minority grouping and reduce discrimination.

In summary, it seems unlikely that sensitivity tests using alternative assumptions would overturn the fundamental conclusion of this analysis—that the federal and state/local savings from raising the high school graduation rate would be very high.


17  There is also a significant effect of education on voting and civic participation, both of which should lead to more effective governance (Dee, 2004). However, the economic value of good governance as a result of higher voting rates is unknown.
18  Juvenile crime is estimated at one-third of the total amount of crime (Levitt and Lochner, 2001), although much juvenile crime does not result in a prison sentence. Therefore, we assume that only one-third of the policing costs should be added and that justice and incarceration costs are negligible. (This is highly conservative because the juvenile incarceration rate is not zero). Maynard (1997) calculates the cost in 1996 dollars of $13,500 per teenage pregnancy. We assume a ten percent reduction in teenage pregnancy and adjust the figures to 2005 dollars.


6  Conclusions

photo

The above analyses indicate that there are substantial economic benefits from raising the rate of high school graduation for New York State. These benefits can therefore be interpreted as the maximum amount that could be spent by federal and state/local governments on educational programs to improve the graduation rate.

However, there is some debate on which programs are effective. Of the many different interventions for increasing high school graduation, only a few have been demonstrated to be effective using high quality research methods. For New York State, interventions that may be considered include: expanded access to pre-school programs; reductions in class sizes in the early grades; improvements in teaching (either by imposing higher standards or offering higher pay); and high school reforms. A related approach would be to promote educational processes that are associated with higher attainment, such as small school size, high expectations of students, high levels of parental engagement and strong institutional support (Quint, 2006; Kuziemko, 2006; Glennan et al., 2004). An alternative approach would be to target reforms and resources towards the schools with the poorest academic performance. In New York State, Wyckoff (2006) identifies this as the ‘imperative of 480 schools’, i.e. those 480 elementary schools (out of 2,400) that contain 70% of all students showing no proficiency by 4th grade. Policies to improve those schools might represent a very efficient way to raise academic performance across the state. Finally, others have argued that educational reforms must take into account the home lives of the students and that the strongest programs for increasing the rate of high school graduation should combine school interventions with ones to help families and improve local communities (Rothstein, 2004; Van Dorn et al., 2006). The actual efficacy and costs of each of these approaches is beyond the scope of this investigation. But we note that the benefits of high school graduation are sufficiently large that most of the interventions which are effective are also likely to be cost-effective.

Finally, this empirical investigation shows significant differences across racial groups. Table 3 shows that Hispanic and African-American students graduate at rates considerably below their white peers. Table 4 illustrates the consequences in terms of absolute numbers of dropouts: minority groups are less than half as numerous as whites and yet there are more minority dropouts. Thus, the state is far from ensuring that all children have a roughly equal chance to graduate. The consequences of this inequality are illustrated by the lifetime differences in economic status. Table 6 shows how Hispanic and African-American males earn less than white males at all education levels. In fact, in absolute money terms the gap between minority and white males is larger for college graduates than for dropouts. Table 8 reports on savings to taxpayers in lower Medicaid and Medicare receipt: the savings are greater for minority persons because they report the lowest health status. Similarly, Table 9 shows how savings to the criminal justice system would be greater per minority dropout, because these persons are disproportionately incarcerated. The same logic applies for welfare receipt: because it is more common for AfricanAmerican females, the greatest savings would be obtained if these persons were offered an adequate education. Therefore, both the disparity in attainment and the greater reliance on public services suggest greater investments for Hispanic and AfricanAmerican school children. These investments would not only satisfy equity goals, but also efficiency goals in terms of fiscal and social savings.


References

Acemoglu, D. 1998. Why do new technologies complement skills? Directed technical change and wage inequality. Quarterly Journal of Economics, CXIII, 1055-1090.

Allgood, S and A Snow. 1998. The marginal cost of raising tax revenue and redistributing income. Journal of Political Economy, 106, 1246-1273.

Anderson, DA. 1999. The aggregate burden of crime. Journal of Law and Economics, XLII, 611-642.

Arum, R and IR Beattie. 1999. High school experience and the risk of adult incarceration. Criminology, 37, 515-537.

Barrett, A and A Poikolainen. 2006. Food Stamp Program Participation Rates, 2004. U.S. Department of Agriculture: Alexandria, Virginia.

Barrow, L and CE Rouse. 2005. Do Returns to Schooling Differ by Race and Ethnicity? Education Research Section, Princeton University, Working Paper Number 11.

Belfield, CR, Nores, M, Barnett, WS and L Schweinhart. 2006. The Perry Pre-School 40-year Follow-up Cost-Benefit Analysis. Journal of Human Resources, 42, 215246.

Bureau of Justice Statistics (BJS). 2002. Sourcebook of Criminal Justice Statistics. 30th Edition. Department of Justice, Washington, DC.

Cameron, SV and JJ Heckman. 1993. The nonequivalence of high school equivalents. Journal of Labor Economics, 111, 1-47.

Carneiro, P and JJ Heckman. 2003. Human Capital Policy. In Inequality in American: What Role for Human Capital Policies? BM Friedman (Ed.). Cambridge, MA: MIT Press.

Cohen MA, Rust RT, Steen S, and ST Tidd. 2004. Willingness-to-pay for crime control programs. Criminology, 42, 89-109.

Cohen, MA. 2005. The Costs of Crime and Justice. Routledge: New York.

CRS. 2004. Cash and non-cash benefits for persons with limited income: Eligibility rule, recipient, and expenditure data, FY 2000-2002. Congressional Research Service, Report RL32233.

Cutler, D, and A Lleras-Muney. 2006. Education and health: evaluating theories and evidence. NBER Working Paper.

De Jesús, A and DW Vasquez. 2005. Exploring the education profile and pipeline for Latinos in New York State. Paper, NYLarnet, www.nylarnet.org

Dee, T. 2004. Are there civic returns to education? Journal of Public Economics, 88, 1697-1720.

Farrington, DP. 2003. Developmental and life-course criminology: Key theoretical and empirical issues. Criminology, 41, 221-246.

Federal Bureau of Investigation (FBI). 2004. Crime in the United States. www.fbi.gov

Fullerton, D. 1991. Reconciling recent estimates of the marginal welfare cost of taxation. American Economic Review, 81, 302-308.

Glennan, TK, Bodilly, SJ, Galegher, JR, and KA Kerr. 2004. Expanding the Reach of Education Reforms. RAND: Washington DC.

Greene, JP and M Winters. 2006. Leaving Boys Behind: Public High School Graduation Rates. www.manhattan-institute.org/pdf/cr_48.pdf

Grogger, J. 2004. Welfare transitions in the 1990s: The economy, welfare policy, and the EITC. Journal of Policy Analysis and Management, 23, 671-695.

Holzer, HJ, Offner, P and E Sorensen. 2004. Declining employment amount young black less-educated men: The role of incarceration and child support. National Poverty Center Working Paper Series, University of Michigan.

Holzman, M. 2004. Public Education and Black Male Students: A State Report Card. Schott Foundation for Public Education, Policy Paper.

Jayakody, RS, Danziger, S and H Pollock. 2000. Welfare reform, substance abuse, and mental health. Journal of Health Politics, Policy and Law, 25, 223-243.

Kirsch, I, Braun, H, Yamamoto, K and A Sum. 2007. America’s Perfect Storm. Three Forces Facing Our Nation’s Future. ETS Policy Brief.

Kuziemko, I. 2006. Using shocks to school enrollment to estimate the effect of school size on student achievement. Economics of Education Review, 25, 63-75.

Levin, H, Belfield, C, Muennig, P and C Rouse. 2007. The costs and benefits of an excellent education for America’s children. Working paper, www.cbcse.org.

Levitt, SD and L Lochner. 2001. The determinants of juvenile crime. In J Gruber (Ed.) Risky Behavior among Youths. An Economic Analysis. University of Chicago Press: Chicago.

Lochner, L and E Moretti. 2004. The effect of education on crime: Evidence from prison inmates, arrests, and self-reports. American Economic Review, 94, 155-189.

Ludwig, J. 2006. The cost of crime: Understanding the financial and human impact of criminal activity. Testimony, US Senate Committee on the Judiciary, September 19, 2006.

Macmillan, R. 2000. Adolescent victimization and income deficits in adulthood: rethinking the costs of criminal violence from a life-course perspective. Criminology, 38, 533-580.

Maynard, R. 1997. Kids Having Kids: Economic Costs and Social Consequences of Teen Pregnancy. Urban Institute Press, Washington, DC.

Miller, TR, Cohen, MA, and B Wiersema. 1996. Victim Costs and Consequences: A New Look. National Institute of Justice Research Report, NCJ-155282.

Moore, MA, Boardman, AE, Vining, AR, Weimer, DL and DH Greenberg. 2004. Just give me a number! Practical values for the social discount rate. Journal of Policy Analysis and Management, 23, 789-812.

Muennig, P. 2005. Health returns to education interventions. Available online at: http://devweb.tc.columbia.edu/centers/EquityCampaign/symposium/Files/81_Muennig_paper.ed.pdf Accessed 11/05.

Orfield, G, Losen, D, Wald, J and CB Swanson. 2004. Losing Our Future: How Minority Youth are Being Left Behind by the Graduation Rate Crisis. Cambridge, MA: The Civil Rights Project at Harvard University.

Osborne Daponte, B, Sanders, S, and L Taylor. 1999. Why do low-income households not use food stamps? Journal of Human Resources, 34, 612-628.

Pager, D. 2003. The mark of a criminal record. American Journal of Sociology, 108, 937-975.

Pettit, B and B Western. 2004. Mass imprisonment and the life course: race and class inequality in US incarceration. American Sociological Review, 69, 151-169.

Quint, J. 2006. Meeting Five Critical Challenges of High School Reform. New York: Manpower Development Research Corporation [MDRC].

Rank, MR and TA Hirschl. 2005. Likelihood of using food stamps during the adulthood years. Journal of Nutrition and Behavior, 37, 137-146.

Raphael, S. 2004. The socioeconomic status of black males: The increasing importance of incarceration. Working paper, UC-Berkeley.

Roberts, DE. 2004. The social and moral costs of mass incarceration in African-American communities. Stanford Law Review, 56, 1271.

Rothstein, R. 2004. Class and Schools. Using Social, Economic and Educational Reform to Close the Black-White Achievement Gap. Teachers College Press and Economic Policy Institute: Washington, DC.

Rouse, CE. 2005. The costs of inadequate education. Working Paper, Teachers College devweb.tc.columbia.edu/manager/symposium/Files/77_Rouse_paper.pdf

Rumberger, R. 2004. Why students drop out of school. In Dropouts in America. G Orfield (Ed). Harvard Education Press: Cambridge, MA.

Schmitt, J and D Baker. 2006. The Impact of Undercounting in the Current Population Survey. Working paper, Center for Economic Policy and Research, Washington DC, www.cepr.net/publications/cps_declining_coverage_2006_08.pdf

Schwartz, AE and L Stiefel. 2004. Immigrants and the distribution of resources within an urban school district. Educational Evaluation and Policy Analysis, 26, 4: 303-327.

Stephan, J. 1999. State Prison Expenditures, 1996. U.S. Department of Justice, Washington, DC.

Swanson, C. 2004. Projections of 2003-04 High School Graduates: Supplemental Analyses. Urban Institute, www.urban.org/UploadedPDF/411019_2003_04_HS_graduates.pdf

Tienda, M. 2007. Changing demography. In CR Belfield and HM Levin (eds). The Price We Pay. Brookings Institution Press: Washington, DC.

US DHHS, ACF. 2004. TANF Sixth Annual Report to Congress. DHHS: Washington, DC.

Van Dorn, RA, Bowen, GL, and JR Blau. 2006. The impact of community diversity and consolidated inequity on dropping out of high school. Family Relations, 55, 105-118.

Waldfogel, J, Garfinkel, I and B Kelly. 2005. Public assistance programs: How much could be saved with improved education? Working paper for Education Symposium, Teachers College, Columbia University.

Western, B, and B Petit. 2000. Incarceration and racial inequality in men’s employment. Industrial and Labor Relations Review, 54, 3-16.

Wolf Harlow, C. 2003. Education and correctional populations. Bureau of Justice Statistics Special Report, Washington, DC: U.S. Department of Justice.

Wong, MD, MF Shapiro, Boscardin WJ, and SL Ettner. 2002. Contribution of major diseases to disparities in mortality. New England Journal of Medicine, 347, 1585-92.

Wyckoff, J. 2006. The imperative of 480 schools. Education Policy and Finance, 1, 279-287.


Tables


Table 1: Public High School Graduation Rates in New York
Table 2: Cohort of Persons Aged 20 in New York
Table 3: Annual State and Federal Spending in Millions
Table 4: Annual Local Government Spending in Millions
Table 5: Labor Market Status: All Persons Aged 21-64
Table 6	Lifetime Income: Present Value for All Persons Aged 20
Table 7: Lifetime Additional Tax Payments per Expected High School Graduate: Present Value at Aged 20
Table 8: Lifetime Health Savings per Expected High School Graduate
Table 9: Annual Crime Rate and Number of Arrests
Table 10: Lifetime Fiscal Crime Savings per Expected High School Graduate
Table 11: Lifetime Fiscal Welfare Savings per Expected High School Graduate
Table 12: Total Lifetime Fiscal Savings per Expected High School Graduate in New York: Federal Government
Table 13: Total Lifetime Fiscal Savings per Expected High School Graduate in New York: State and Local Government
Table 14: Total Lifetime Fiscal Savings per Cohort of Persons Aged 20 in New York: State and Local Government
Table 15: Total Lifetime Social Savings per Expected High School Graduate in New York
Table 16: Sensitivity Tests on the Fiscal Benefits of High School Graduation


Puerto Rican/Hispanic Task Force Seal New York State Puerto Rican/Hispanic Task Force
Assemblyman Peter M. Rivera, Chair
Legislative Office Building, Room 826
Albany, New York 12248
Telephone: (518) 455-5102
Fax: (518) 455-3693

New York State Assembly
[ Welcome Page ] [ Committee Updates ]